Figures & data
Figure 1 NHLBI step diagram – illustrates the step-based categorization based on patients' treatment recommended by NHLBI.
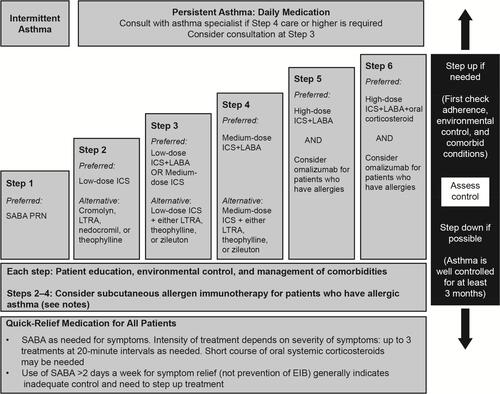
Table 1 Description of Patient Demographics, History of Exacerbation(s), NHLBI Step, Comorbid Conditions, and Treatments Ascertained at Index or During the 12-Month Baseline Period
Table 2 Asthma-Related HRU and Cost During the 12-Month Baseline Period for All Patients
Figure 2 Patient flow diagram – describes patient attrition throughout the study and step classification.Abbreviaton: NHLBI, National Heart, Lung, and Blood Institute.
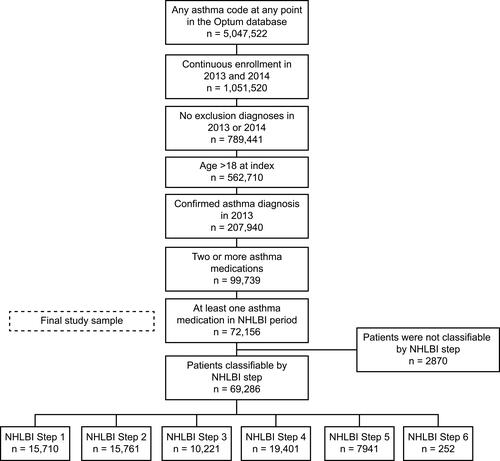
Figure 3 Exacerbations during the follow-up period (2014) by NHLBI step (n=10,590) – bar chart shows the proportion of patients who experienced an exacerbation in the follow-up period, classified by NHLBI step.
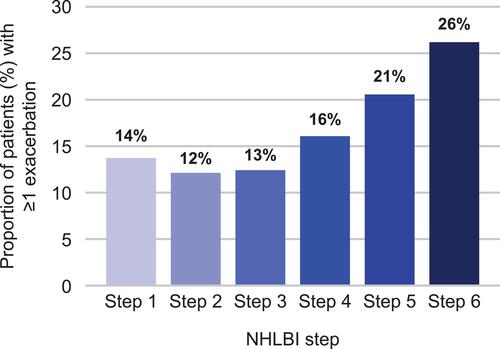
Table 3 Asthma-Related HRU and Cost in All Patients and the Exacerbating Population in the 12-Month Follow-Up Period
Figure 4 Asthma-related HRU during the follow-up period (2014) by NHLBI step for the overall population (N=72,156) – bar charts illustrate the proportion of all patients who required hospitalization (A), ED visit (B), or outpatient department visit (C) during the follow-up period, classified by NHLBI step.
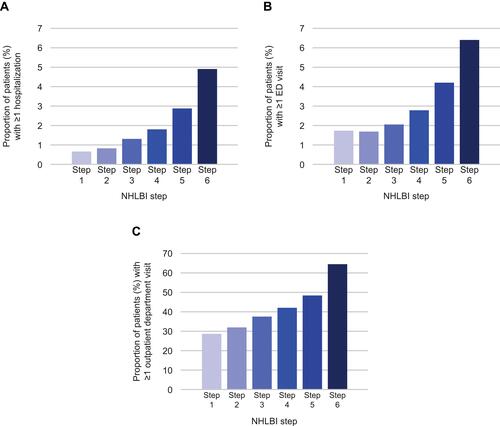
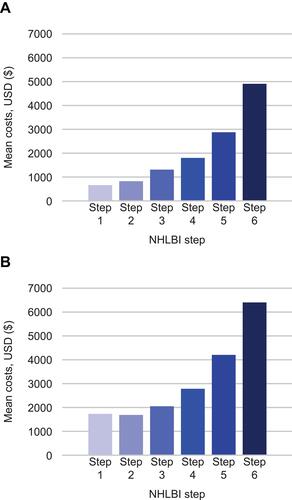
Figure 5 Asthma-related total costs during the follow-up period (2014) by NHLBI step – bar charts illustrate the cost associated with patients in each NHLBI step for both the overall population (A) and for those who experienced ≥1 exacerbation during follow-up (B). Costs were adjusted to 2016 USD ($).