Figures & data
Table 1 Clinical Features of AR Patients and Healthy Controls Included in the Study
Table 2 Information of AR Patients in the Study
Figure 1 Expression of SLAM/SAP in CD4+CXCR5+ T cells in AR patients. (A and B) Gating strategy and representative flow plot. (C) Frequencies of CXCR5+ cells among CD4+ T cells within PBMCs. (D) Detection of SLAM/SAP expression was gated on CD3+CD4+CXCR5+ T cells. (E) Representative SLAM plot. (F) The expression of SLAM. (G) Representative plot of SAP. (H) The expression of SAP. (I) The correlation between the expression of SLAM and SAP in CD4+CXCR5+ T cells from AR patients. (J) The correlation between the expression of SLAM and IgE in AR patients. (K) The correlation between the expression of SAP and IgE in AR patients. *P<0.05; **P<0.01.
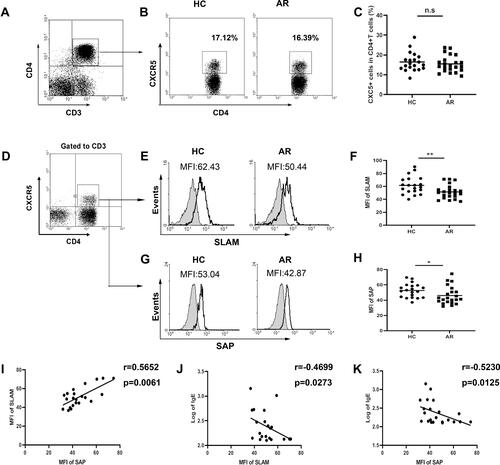
Figure 2 High levels of IL-21 in AR patients. (A) Level of serum IL-21. (B) The correlation between serum IL-21 and IgE. (C) The correlation between SLAM and IL-21. (D) The correlation between SAP and IL-21. **P<0.01.
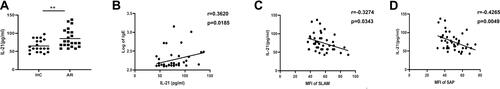
Figure 3 SLAM reduced the production of IL-21 in CD4+CXCR5+ T cells. (A) The purity of CD4+CXCR5+ cells was analyzed by FCM. (B) The levels of IL-21 secreted by CD4+CXCR5+ T cells with anti-SLAM mAb stimulation (0.5 µg/mL, 48 h, n=6). (C and D) The levels of IL-21 secreted by CD4+CXCR5+ T cells after anti-SLAM stimulation at different time points or at different concentrations. *P<0.05.
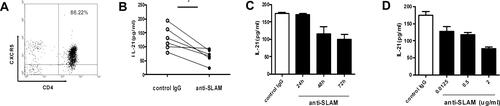
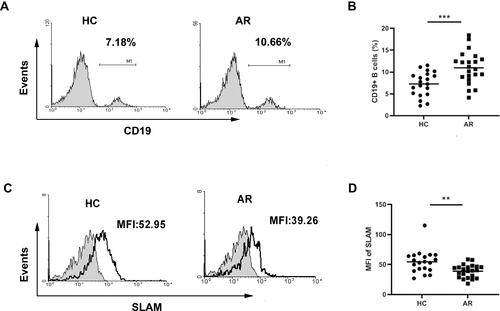
Figure 4 Expression of SLAM on the B cell surface in AR patients. (A) Representative flow plot of CD19+ B cells. (B) Frequencies of CD19+ B cells in PBMCs. (C) Representative plot of SLAM. (D) The expression of SLAM on the CD19+ B cell surface. **P<0.01; ***P<0.001.