Figures & data
Figure 1 Smartphone-based collection allows for much richer data capture. Circular representation of a year of data (October 2018 to September 2019) from a single participant. The inner ring (1) shows daily step count as measured by the smartphone. The middle ring (2) shows the level of types of pollen on a normalized scale in their location for the year. The outer ring (3) quantifies symptom data and highlights the magnitude of longitudinal data that can be captured.
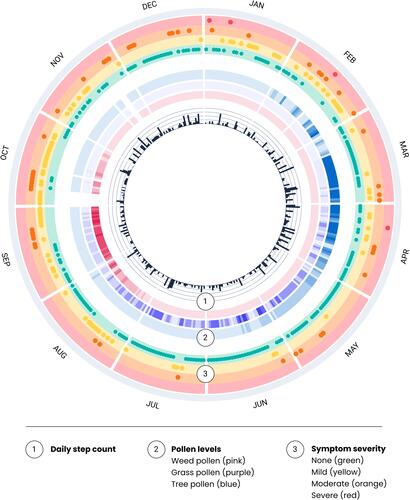
Figure 2 Collecting real world data symptom and sensor data on a smartphone which feeds into a machine learning model that can predict individual risk of allergy symptoms.
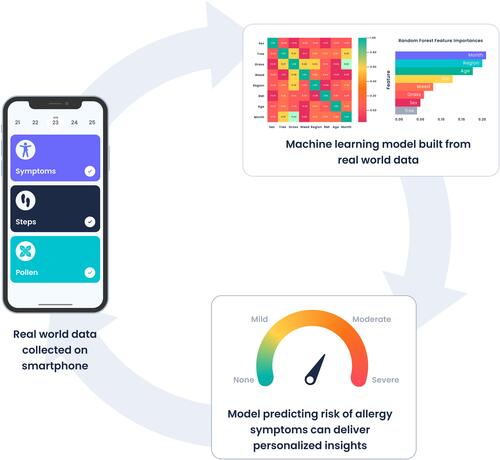
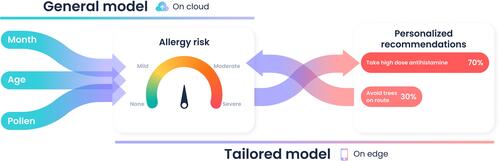
Figure 3 Planned future direction shows how risk prediction can be integrated into a tailored model for personalized recommendations.