
Figures & data
Figure 1 SABA usage in the last week (n=736).
Notes: Survey question: “Thinking about the last week. How many times have you used your reliever inhaler? (This is usually a blue colour)”; The reported percentages are rounded to whole numbers.
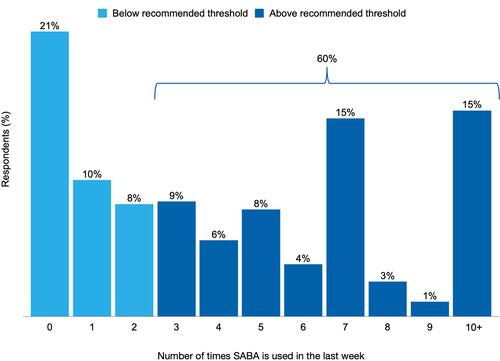
Table 1 Demographics and Characteristics as Reported by Respondents According to SABA Use (n=736)
Figure 2 Indicators of exacerbations (n=736), according to SABA use (<3 times or ≥3 times/week).
Notes: <3 SABA (Low-SABA users) n=294; ≥ 3 SABA (High-SABA users) n=442; P values are two sided; The reported percentages are rounded to whole numbers. •Significant difference p<0.001.
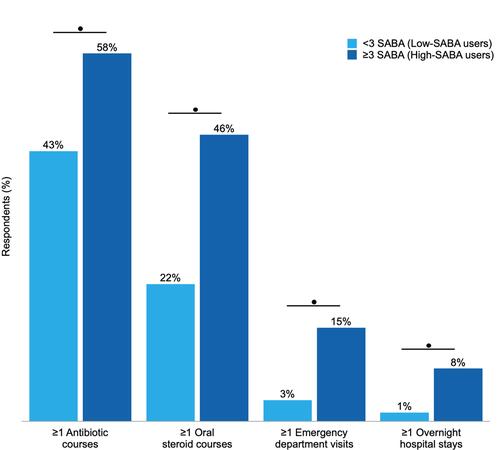
Figure 3 Indicators of asthma symptoms (n=736), according to SABA use (<3 or ≥3 times/week).
Notes: <3 SABA (Low-SABA users) n=294; ≥3 SABA (High-SABA users) n=442; P values are two sided, (A) p=0.895, (B) p=0.265, (C) p= 0.109; The reported percentages are rounded to whole numbers.
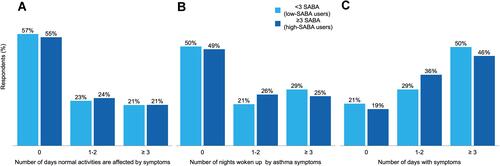
Table 2 Relation Between Moderate (A)/Severe (B) Exacerbations and SABA Use Adjusted for Confounders (n=736)