Figures & data
Table 1 Differential Diagnostic Approach
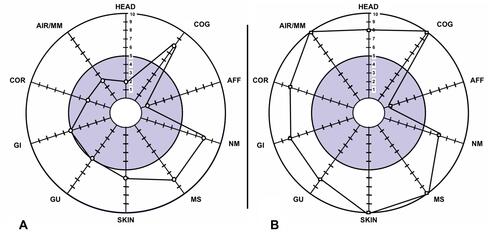
Figure 1 QEESI symptom Star21: Illustration representing the symptom severity in our patient before and after the exposure event. Scale ranges from 1 to 10 in symptom severity. (A) Pre-exposure: circles represent pre-exposure. Each nomenclature represents a system. Circles were placed in the score corresponding to the symptoms before exposure. The most affected systems were cognitive, neuromuscular, and musculoskeletal. (B) Post-exposure: squares represent post-exposure. Each nomenclature represents a system. Squares were placed in the score corresponding to the symptoms after exposure. The symptoms showed a significant increase compared with the pre-exposure symptoms in all systems. The affective, neuromuscular, and cognitive systems were usually affected independently of exposure.