
Figures & data
Table 1 Basic Laboratory Work-Up of a Female Patient with AD-HIES
Figure 1 Pulmonary imaging by CT scan before and after treatment.
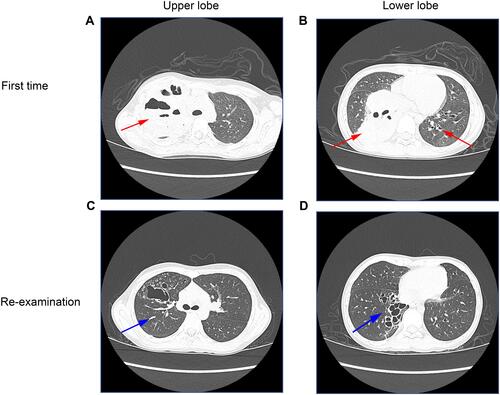
Figure 2 (A) Tracheal microscopy image of the right upper lobe at the first time of bronchoscope. (B) The tracheal microscopy image of the right middle lower lobe at the first time of bronchoscope. (C and D) Tracheal microscopy images were captured at same location, (C) for the right upper lobe and (D) for the right middle lower lobe, when the patient was re-examined half a month later, after four bronchoscope procedures and antibiotic treatments.
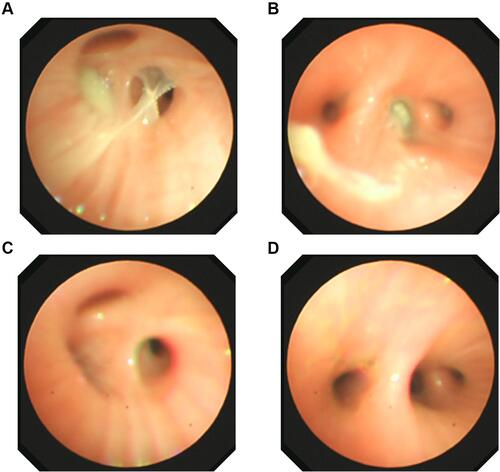
Table 2 Scoring of This Patient According to the NIH HIES Scoring System
Table 3 Dynamic Analysis of Changes in Blood Cell Counts Before and After Four Bronchoscopic Lavages
Table 4 Dynamic Analysis of Changes in Inflammatory Cytokine Levels in BALF Before and After Four Bronchoscopic Lavages
Figure 3 A de novo mutation in STAT3 and decreased number of Th17 cells were detected.
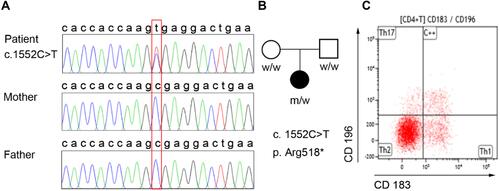
Table 5 Analysis of the Serum T Helper Cell Counts in This Patient