Figures & data
Table 1 Patients’ characteristics
Table 2 Comparison of vitamin D levels in asthmatic patients and controls
Figure 1 Vitamin D concentrations of asthmatic patients.
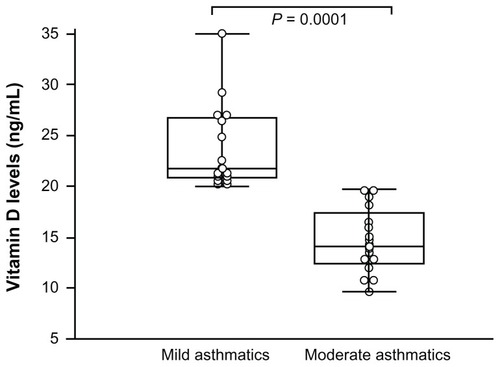
Figure 2 Correlation between vitamin D level and serum IL-6 (A) and serum IL-17 (B) using, Pearson’s correlation coefficient.
Abbreviation: IL, interleukin.
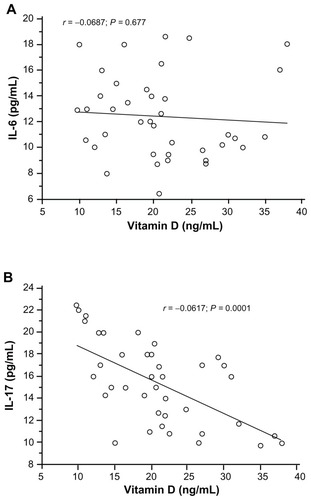
Figure 3 Intracellular Th1 and Th2 cytokines. (A–D) Box and whiskers plot of (A) percentage of interferon-gamma (IFN-γ) producing cells; (B) percentage of IL-4 producing cells; and (C) the ratio of Th1/Th2 cytokine (interferon-gamma [IFN-γ] and IL-4) determined by Fast Immune Cytokine System for normal controls (n = 30) and asthmatic patients (n = 39). The medians are indicated by a line inside each box, the 25th and 75th percentiles are indicated by the box limits, and the lower and upper error bars represent the 10th and 90th percentiles, respectively. The mean values were compared and the P values are indicated at the figure. (D) Correlation between Th1/Th2 ratio and vitamin D levels in asthmatic patients using Pearson’s correlation coefficient.
Abbreviation: IL, interleukin.
![Figure 3 Intracellular Th1 and Th2 cytokines. (A–D) Box and whiskers plot of (A) percentage of interferon-gamma (IFN-γ) producing cells; (B) percentage of IL-4 producing cells; and (C) the ratio of Th1/Th2 cytokine (interferon-gamma [IFN-γ] and IL-4) determined by Fast Immune Cytokine System for normal controls (n = 30) and asthmatic patients (n = 39). The medians are indicated by a line inside each box, the 25th and 75th percentiles are indicated by the box limits, and the lower and upper error bars represent the 10th and 90th percentiles, respectively. The mean values were compared and the P values are indicated at the figure. (D) Correlation between Th1/Th2 ratio and vitamin D levels in asthmatic patients using Pearson’s correlation coefficient.](/cms/asset/ce5c32f9-44fa-4b4b-8e1d-0829ff868718/djaa_a_29566_f0003_b.jpg)
Figure 4 Intracellular Type 1 regulatory T (Tr1) cells (IL-10) and Th17 (IL-17) cytokines CD4+ production.
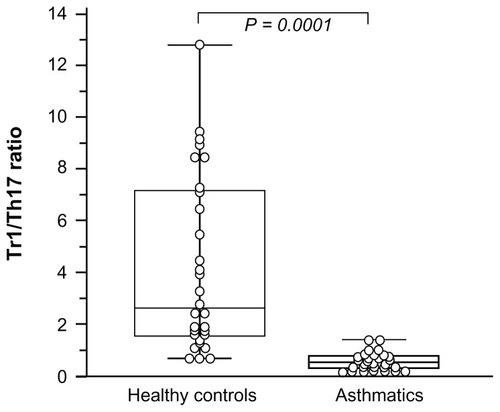
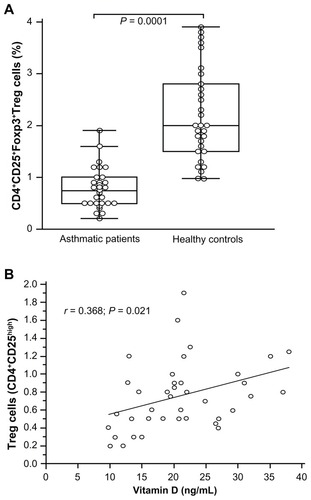
Figure 5 CD25+Foxp3+ Treg in the CD4+ T cell compartment. Box and whiskers plot of percentage of CD25+Foxp3+ Treg in the CD4+ T cells (A). The medians are indicated by a line inside each box, the 25th and 75th percentiles are indicated by the box limits, and the lower and upper error bars represent the 10th and 90th percentiles, respectively. Correlation between CD25+Foxp3+ Treg cells and vitamin D levels in asthmatic patients using Pearson’s correlation coefficient (B).