Figures & data
Table 1 Baseline Patient Features
Figure 1 Efficacy of benralizumab in the whole population of patients with severe persistent eosinophilic asthma, with regard to asthma exacerbation rate (A), prednisone intake (B), daily SABA inhalations (C), ACT score (D), AQLQ score (E), FEV1 (F), FVC (G), blood eosinophil numbers (H), blood basophil count (I), and FeNO levels (J). ACT score values are expressed as mean (± SD). All other parameters are expressed as median values (IQR). **p < 0.01; ***p < 0.001; ****p < 0.0001.
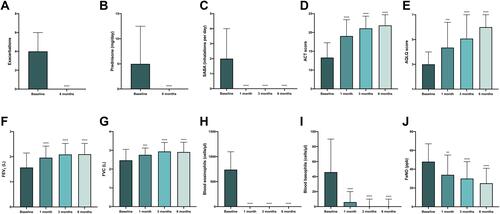
Figure 2 Efficacy of benralizumab in relation to SPT negativity or positivity, with regard to asthma exacerbation rate (A), prednisone intake (B), daily SABA inhalations (C), ACT score (D), AQLQ score (E), FEV1 (F), FVC (G), blood eosinophil numbers (H), blood basophil count (I), and FeNO levels (J). Boxes display median values and IQR, and whiskers define maximum and minimum. *p < 0.05; **p < 0.01.
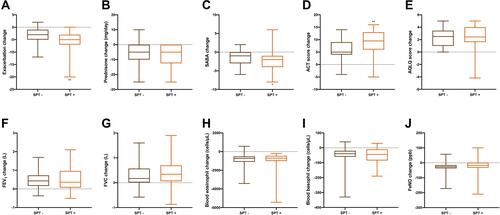
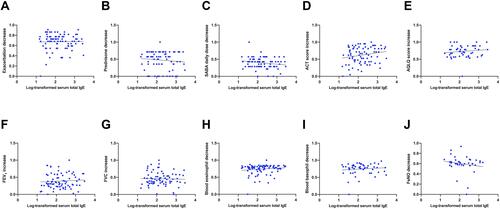
Figure 3 Correlations between serum IgE concentrations, expressed as logarithmic transformation, and 6-month modifications elicited by benralizumab, with regard to asthma exacerbation rate (A), prednisone intake (B), daily SABA inhalations (C), ACT score (D), AQLQ score (E), FEV1 (F), FVC (G), blood eosinophil numbers (H), blood basophil count (I), and FeNO levels (J).