Figures & data
Figure 1 Participant flow chart.
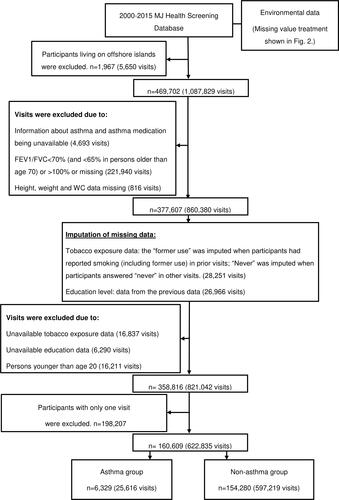
Figure 2 Environmental data cleaning flow chart.
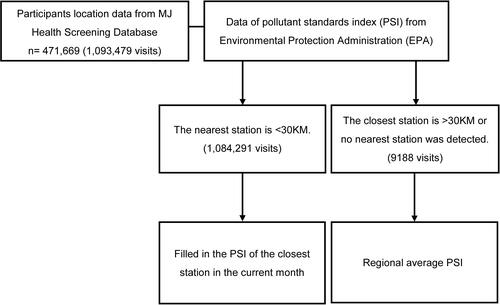
Table 1 Baseline Characteristics of Asthmatic and Non-Asthmatic Participants
Figure 3 Effect of obesity indicators on FVC and FVC%. (A) The associations between obesity and FVC among asthma and non-asthma participants. Adjusted for season, sex, age group, education, HTN, DM†, AHTN†‡¶, AHG‡¶, psychiatric medication (PM)†‡¶, and pollutant standards index (PSI). (B) The associations between obesity and FVC% among asthma and non-asthma participants. Adjusted for season, sex, age group, education, PM, PSI, and physical activity. †, ‡, and ¶Means only adjustment in the BMI, WC, and WHtR, respectively. §Means per 1% increase. *p<0.05, **p<0.01, ***p<0.001.
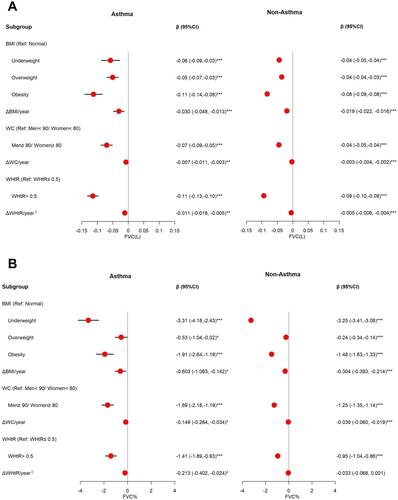
Figure 4 Effect of obesity indicators on ΔFVC/year and ΔFVC%/year. (A) The associations between obesity and ΔFVC/year among asthma and non-asthma participants. Adjusted for season, sex, age group, and education (B) The associations between obesity and ΔFVC%/year among asthma and non-asthma participants. Adjusted for season, sex, age, group, education, and PSI. §Means per 1% increase. *p<0.05, **p<0.01, ***p<0.001.
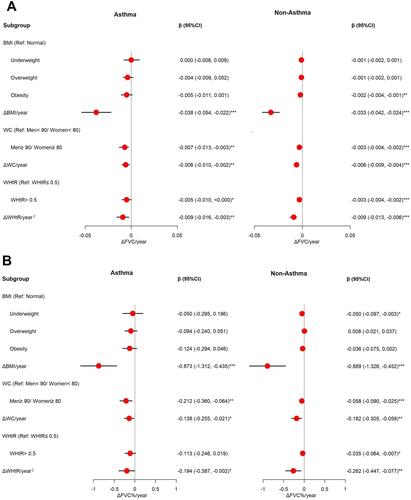
Table 2 Effect of Asthma Combined with Obesity on Lung Function
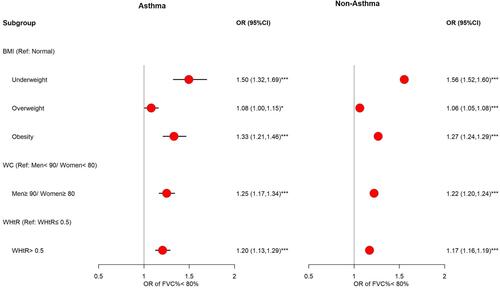
Figure 5 Effect of obesity indicators on restrictive lung function. The associations between obesity (defined by BMI, WC and WHtR) and restrictive lung function among asthma and non-asthma participants. Adjusted for season, sex, age group, education, psychiatric medication (PM), pollutant standards index (PSI), and physical activity. *p<0.05, ***p<0.001.