Figures & data
Table 1 Baseline Demographic Data for Patients with CRS Enrolled in This Study (N =34)
Table 2 Patient-Reported Outcome Measure (PROM) Comparisons
Table 3 Inflammatory Gene Expression Ratio Comparisons in the Peripheral Blood of Patients with CRSsNP-A vs CRSsNP
Table 4 Inflammatory Gene Expression in the Peripheral Blood of Patients with CRSwNP-A vs CRSwNP
Figure 1 Genetic transcriptional changes in peripheral blood favor a type 2 inflammatory profile among patients with CRSsNP-A compared to CRSsNP. (A) HLA-DRB3 is significantly upregulated in CRSsNP-A compared to CRSsNP (Th2, p<0.02). (B) CASP2 (Th2, p<0.04), NFATC3 (Th2, p<0.04), and NFKB1 (Th2, p<0.02) are downregulated in CRSsNP-A compared to CRSsNP.
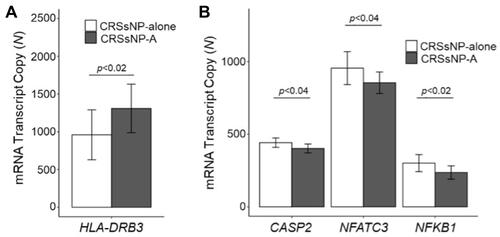
Figure 2 Upregulated genetic transcriptional changes in peripheral blood favor a type 2 inflammatory profile among patients with CRSwNP-A compared to CRSwNP. CCL4 (Th2, p<0.01), IKBKB (Th2, p<0.04), IKZF2 (Th2, p<0.02), and ILF3 (Th2, p<0.02) are significantly upregulated in CRSwNP-A compared to CRSwNP.
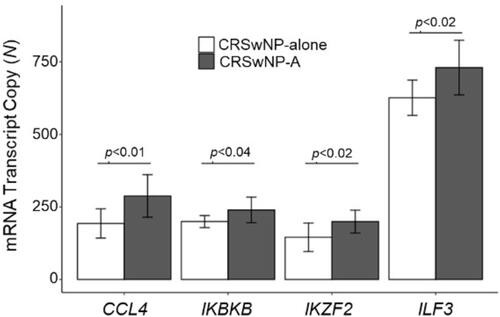
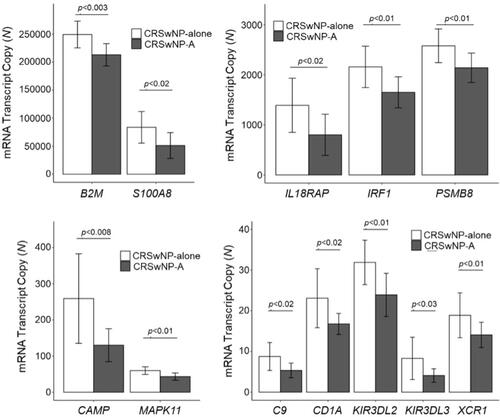
Figure 3 Downregulation of genes predominantly associated with Th1 and Th17 inflammation in peripheral blood favor an overall type 2 profile in patients with CRSwNP-A compared to CRSwNP.