Figures & data
Figure 1 Representative ROIs of the lung on the 18F-FDG PET/CT. Circular ROIs were drawn on the lateral peripheral regions of the RUL, RLL, LUL, and LLL.
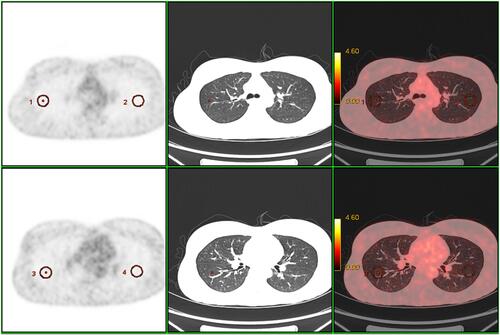
Table 1 Demographic Data of Non-Smokers, Ex-Smokers and Current Smokers
Table 2 Differences in the Lung SUV According to Smoking Status
Figure 2 Differences in SUVmax-avr (A) and SUVmean-avr (B) between non-smokers, ex-smokers, and current smokers. The data are presented as box plots (median, interquartile range, range). *P< 0. 05 (two-tailed unpaired t-test). SUVmax-avr, the average of maximum SUVs, and SUVmean-avr, the average of mean SUVs, were measured in the RUL, RLL, LUL, and LLL.
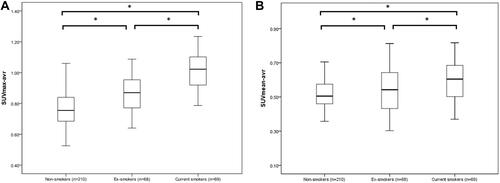
Figure 3 (A) The correlation between tobacco burden (pack years) and SUVmax-avr in ex-smokers (r = 0.171, P = 0.162). (B) The correlation between duration of smoking cessation (years) and SUVmax-avr in ex-smokers (r = 0.212, P = 0.082). (C) The correlation between tobacco burden (pack years) and SUVmax-avr in current smokers (r = 0.474, P< 0.001).
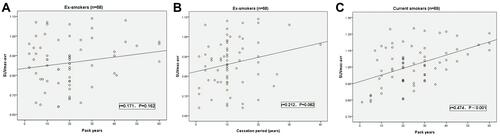
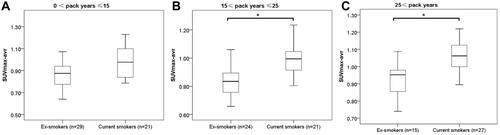
Figure 4 Differences in SUVmax-avr between ex-smokers and current smokers with a smaller tobacco burden (0 < pack years ≤ 15, (A) medium tobacco burden (15 < pack years ≤ 25, (B) and larger tobacco burden (pack years >25, (C)). Data are presented as box plots (median, interquartile range, range). *P< 0. 05 (two-tailed unpaired t-test).