Figures & data
Table 1 Distribution of Plant Allergens and CCD in 170 Polysensitised Allergic Rhinitis Patients
Figure 1 Prevalence rates and sIgE levels of CCD and plant allergens in 170 patients.
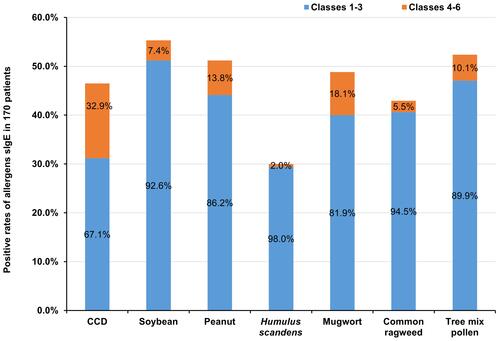
Figure 2 Relationship between plant allergen sensitisation and CCD-sIgE. (A) Radar charts of plant allergens sIgE in CCD sIgE-negative or CCD sIgE-positive patients, (B) the positivity of plant allergens sIgE in patients with different CCD classes. CCD-sIgE negative (n=91), CCD-sIgE positive (n=79), CCD-sIgE classes 1–3 (n=53), CCD-sIgE classes 4–6 (n=26).
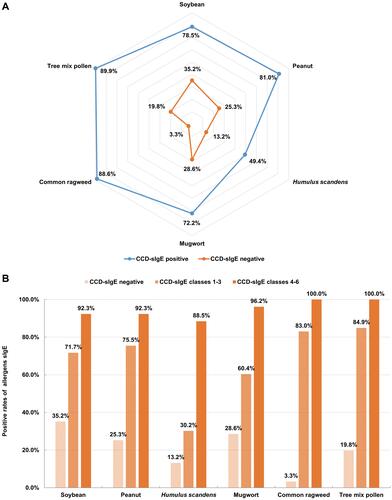
Figure 3 Optimal scale analysis of the sIgE levels of CCD and plant allergens. The closer the distance between the points is, the greater the likelihood that they contain the same information, indicating a closer relationship between them. The close proximity of CCD and ragweed and tree pollen allergens indicated that they have the closest relationship (Cronbach’s alpha=95.6%, suitable for this analysis).
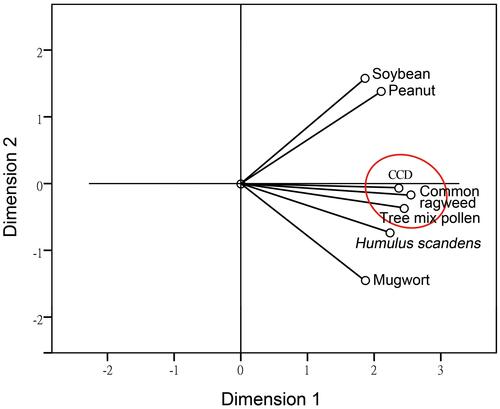
Figure 4 Changes in plant allergens before and after CCD inhibition. (A) CCD-positive patients (n=33), (B) CCD-negative patients (n=17). **P<0.01, the positivity rate before and after inhibition was significantly different.
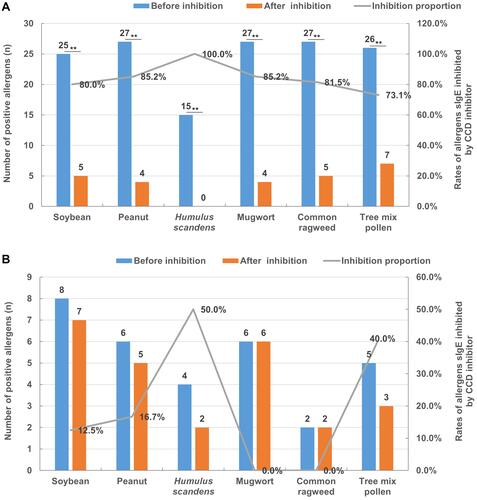
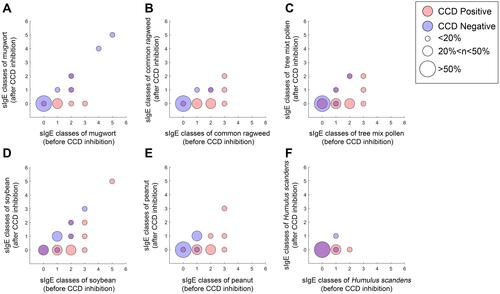
Figure 5 The scatter diagram of plant allergen sIgE classes before or after CCD inhibited. (A) for mugwort (CCD positive/negative n=27/6), (B) for common ragweed (CCD positive/negative n=27/2), (C) for tree mix pollen (CCD positive/negative n=26/5), (D) for soybean (CCD positive/negative n=25/8), (E) for peanut (CCD positive/negative n=27/6), (F) for Humulus scandens (CCD positive/negative n=15/4).