Figures & data
Figure 1 ILC2-stimulating cytokines induced the highest in vitro proliferation rate and favored c-Kitlow cell maintenance. (A) Gating strategy used to sort fresh ILC2s from PBMCs. (B) Scheme representing the different culture conditions used in the experiment. Freshly sorted ILC2s were put in culture in medium with IL-2 and IL-7, supplemented either with mouse stromal OP9 cells (n=6 HD samples from 4 independent experiments) or PHA (n=4 HD samples from 4 independent experiments). The same setting was used with the addition of a cytokine cocktail composed of IL-25, IL-33 and TSLP (n=between 4 and 6 HD samples from 4 independent experiments). (C) Representative examples of expanded ILC2s in the different culture conditions (n=between 4 and 6 HD samples from 4 independent experiments) (magnification = 10x). (D) Quantification of the ILC2s counted after 17–19 days of expansion for each culture condition (n=4/6). (E) Fold change of ILC2s after the culture relative to initially plated cells. (F) Representative dotplots of c-Kithigh and c-Kitlow ILC2 populations ex vivo and after expansion in each culture condition (n=between 4 and 6 HD samples from 4 independent experiments). (G) Quantification of c-Kithigh and c-Kitlow ILC2 populations ex vivo and after expansion in each culture condition (n=between 4 and 6 HD samples from 4 independent experiments). Data are shown as mean ± standard error of the mean (SEM). Significance was calculated using one-way ANOVA where *P<0.05.
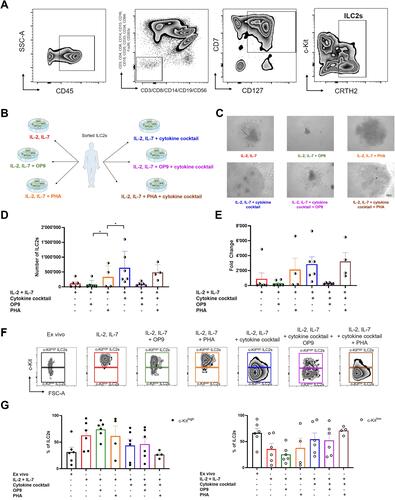
Figure 2 Different culture conditions affected marker expression in c-Kithigh and c-Kitlow ILC2s. Representative dotplots and quantification of CD25 (A), KLRG1 (B), PD-1 (C), CD69 (D) and HLA-DR (E) in ex vivo and in vitro expanded ILC2s, across different culture conditions (n=between 4 and 6 HD samples from 4 independent experiments). Data are shown as mean ± standard error of the mean (SEM). Significance was calculated using one-way ANOVA where *P<0.05, **P<0.01, ***P<0.001, ****P<0.0001.
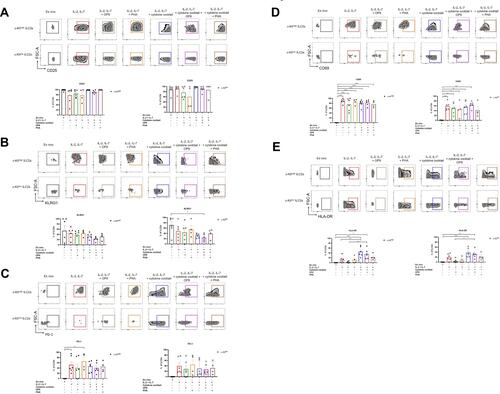
Figure 3 ILC2s expanded with IL-2 and IL-7 and re-challenged with IL-33 displayed an increased IL-5 and IL-13 secretion. (A) Schematic representation of the experimental design: after the expansion, ILC2s from each condition (n=between 4 and 6 HD samples from 4 independent experiments) were separately harvested and re-plated for a 48 hours cytokine stimulation. Cells were stimulated with IL-2 as control, added with IL-25, IL-33 or a combination of both. The readout was performed using the LEGENDplex assay kit. ILC2s expanded with IL-2 and IL-7 (n=6 HD samples from 4 independent experiments) secreted more IL-5 (B) and IL-13 (C) upon IL-33 stimulation. IL-5 (D) and IL-13 (E) secretion were not modulated upon the different stimulations when ILC2s were expanded with the cytokine cocktail, added or not with OP9 cells (n=6 HD samples from 4 independent experiments) or PHA (n=4 HD samples from 4 independent experiments). Data are shown as mean ± standard error of the mean (SEM). Significance was calculated using one-way ANOVA where *P<0.05, **P<0.01, ***P<0.001.
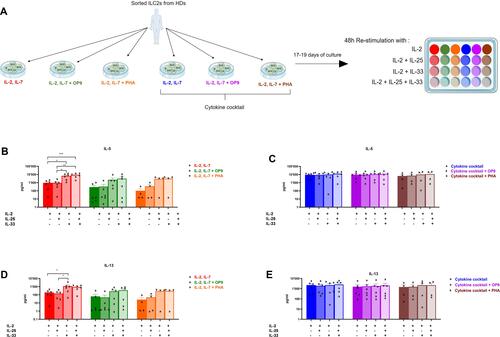
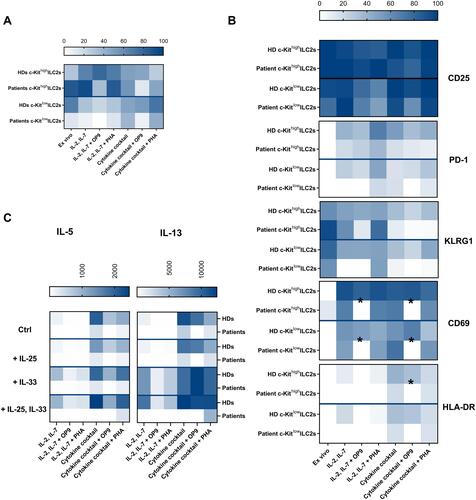
Figure 4 Distinct in vitro behavior of healthy donor-derived and patients ILC2s. Heat maps representing the comparison of HDs (n=between 4 and 6 HD samples from 4 independent experiments) and allergic patients (n=3 allergic patient samples from 2 independent experiments) for the proportion of c-Kithigh and c-Kitlow ILC2s ex vivo and after the expansion in the different culture conditions (A), the activation marker expression (B) and the cytokine secretion profile upon re-stimulation (C). Data are shown as mean ± standard error of the mean (SEM). Significance was calculated using two-way ANOVA where *P<0.05.