Figures & data
Table 1 Characteristics of Infants with and without Atopic Dermatitis
Figure 1 Venn diagram of the observed operational taxonomic units in the non-AD (NG) and AD (AG) groups.
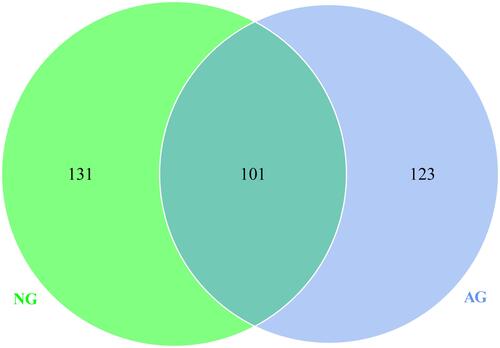
Figure 2 Species accumulation boxplot.
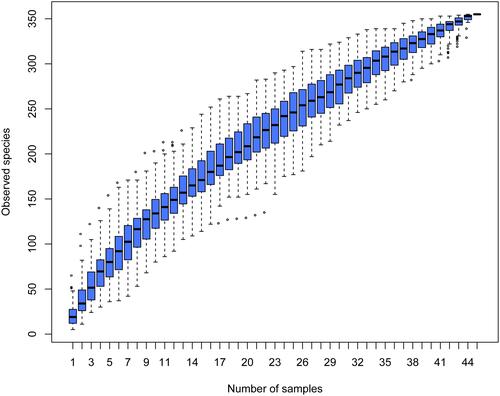
Figure 3 The top 10 relative abundances of bacteria at phylum (A), family (B) genus (C) and species (D) levels in fecal samples from the non-AD (NG) and AD (AG) groups.
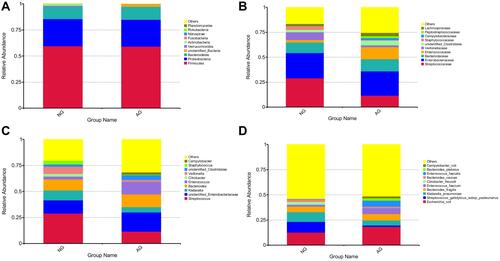
Figure 4 Cladogram of biomarkers for the AD group. The red circle represented biomarkers. Concentric rings from outside to inside were genus, family, order, class, and phylum.
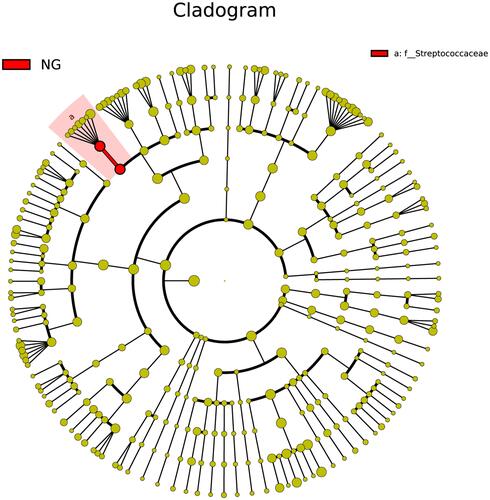
Figure 5 Distribution of the Chao1 index (A) and Shannon index (B) in the non-AD (NG) and AD (AG) group infants.
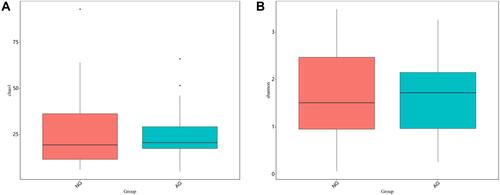
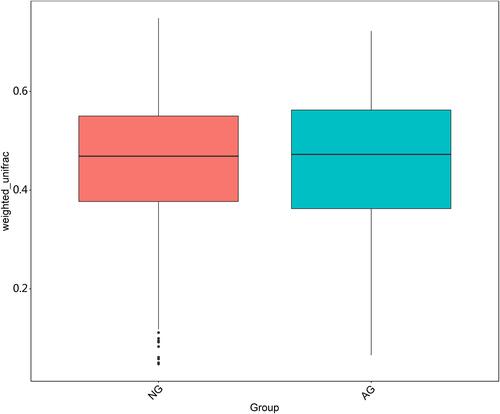
Figure 6 Gut microbial β diversity in the non-AD (NG) and AD group (AG) infants.