
Figures & data
Figure 1 Study design. *Patient or caregiver to return used APFS or AI and completed questionnaire to the study site.
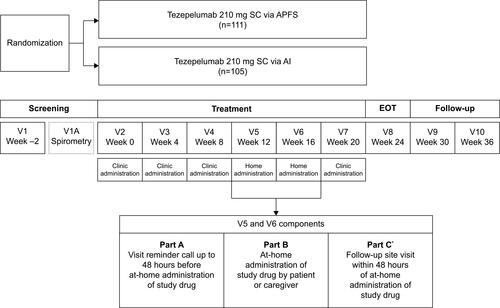
Table 1 Baseline Demographics and Clinical Characteristics of Study Participants
Figure 2 Proportion of HCPs, patients and caregivers who successfully administered tezepelumab via APFS or AI in (A) the overall population and (B) adolescents only. Values in the bars represent the number of patients who administered study drug successfully out of the total number of patients who received or attempted to receive study drug.
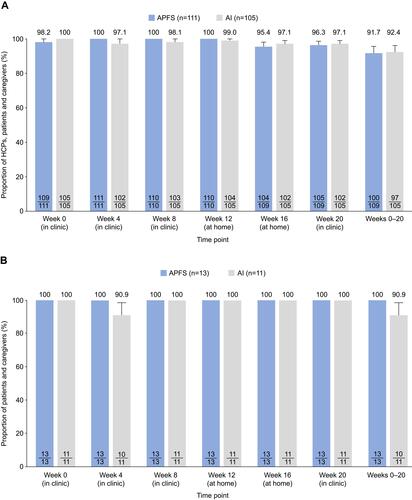
Table 2 Proportion of HCPs, Patients and Caregivers Who Successfully Administered Tezepelumab via APFS or AI
Table 3 Proportion of Devices Reported as Malfunctioning
Figure 3 Proportion of patients with well-controlled, partially controlled and not well-controlled asthma at baseline and at week 24, by device group. aData were missing for two patients in the APFS group and the mean ACQ-6 score was not calculated for these patients.
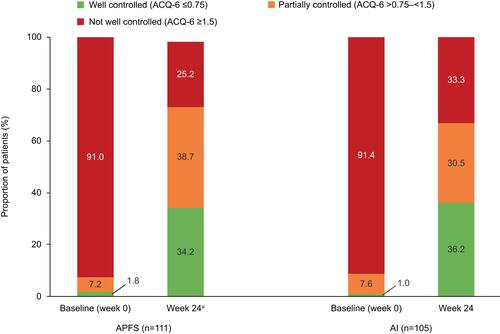
Table 4 Proportions of Patients Who Reported AEs During the Treatment Period