Figures & data
Table 1 Demographics and Clinical Characteristics of Enrolled Patients*
Figure 1 Mean (±SD) SGRQ scores* according to treatment category at enrollment.
Notes: *Scores range from 0 (perfect health) to 100 (maximum impairment).
Abbreviations: HD ICS+, high-dosage inhaled corticosteroids and additional controllers; mSCS, maintenance systemic corticosteroids; SD, standard deviation; SGRQ, St. George’s Respiratory Questionnaire.
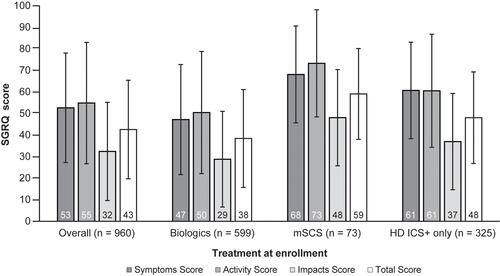
Figure 2 WPAI results according to treatment category at enrollment*,†.
Notes: *Patients not employed reported ability to complete daily activities. †Overall work impairment is the sum of (a) work hours missed and (b) hours worked multiplied by impairment while working because of asthma (20).
Abbreviations: HD ICS+, high-dosage inhaled corticosteroids and additional controllers; mSCS, maintenance systemic corticosteroid; WPAI, Work Productivity and Activity Impairment.

Figure 3 SGRQ scores by patient-reported health.*,†,‡.
Notes: *Score range: 0 (perfect health) to 100 (maximum impairment). †18 respondents with incomplete or missing data excluded. ‡Interquartile range is represented by a filled box. The bar represents median value; X represents mean. Whiskers represent minimum and maximum observation, accounting for outliers (filled circles).
Abbreviations: SGRQ, St. George’s Respiratory Questionnaire.
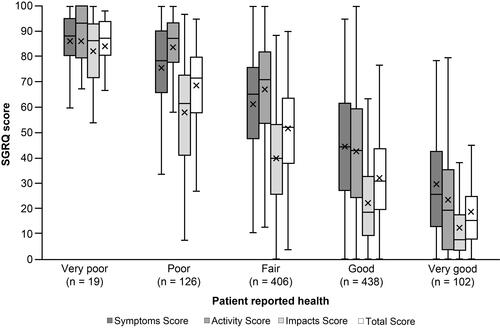
Figure 4 Percentage of patients responding “true” to specific disease effects collected by the SGRQ.*.
Note: *Questions listed in this figure are paraphrased from the SGRQ.
Abbreviations: SGRQ, St. George’s Respiratory Questionnaire; SOB, shortness of breath.
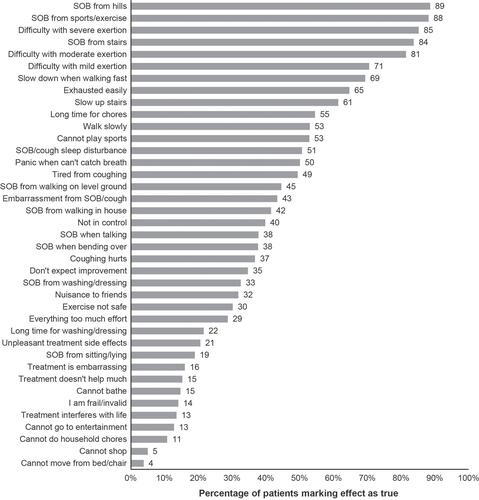
Figure 5 Word cloud of patient-reported free-text responses to the SGRQ prompt for “other activities that your respiratory problems may prevent you from doing.”*.
Notes: *The more frequently a specific word was reported, the bigger and bolder it appears in the word cloud. Adapted from WordItOut (http://worditout.com).
Abbreviations: SGRQ, St. George’s Respiratory Questionnaire.
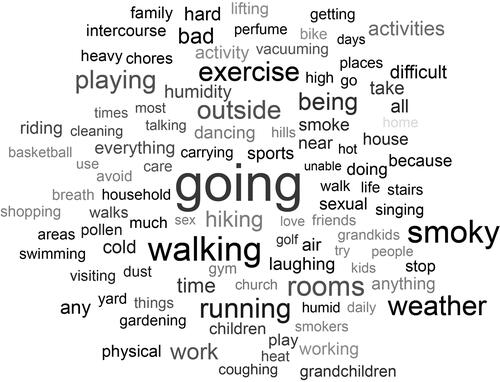
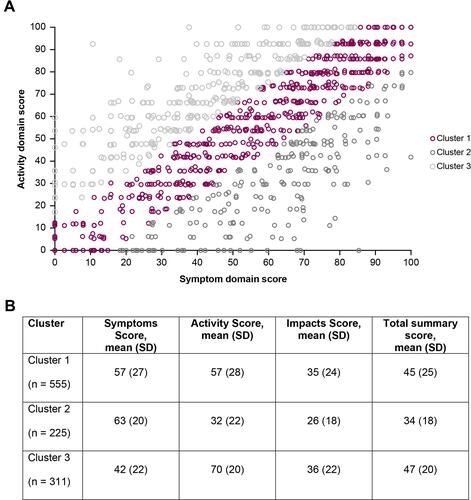
Figure 6 Comparison of patient SGRQ Activity and Symptoms component scores*. Panel (A) Distribution of patient clusters; Panel (B) Mean component and total scores by cluster.
Notes: *Scores range from 0 (perfect health) to 100 (maximum impairment). Cluster 1, Symptoms and Activity score difference <15; Cluster 2, better Activity score than Symptoms score; Cluster 3, better Symptoms score than Activity score.
Abbreviations: SGRQ, St. George’s Respiratory Questionnaire.