Figures & data
Figure 1 Effects of rCypA on pulmonary resistance (RL) in asthmatic rats. (A) Time–response curves of blank, asthmatic rats (AS), terbutaline (TB), hydrocortisone (HC) and recombinant CypA (rCypA) in asthmatic rats. The data are presented as the mean ± SEM (n = 8). (B) Boxplot analysis of the sum value in RL during the 2–4 min of the early airway response (RL2–4min). *P < 0.05 for TB, HC and rCypA groups vs AS group.
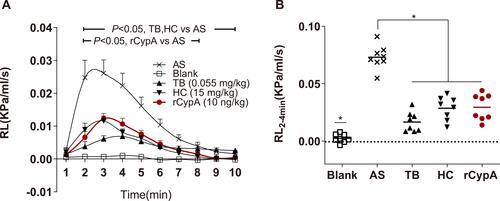
Figure 2 Effects of rCypA on isometric tension of tracheal spirals. (A) Time–response curves of the blank, ACh group (ACh), terbutaline (TB), hydrocortisone (HC) and recombination CypA (rCypA) groups in isolated tracheal spirals. The data are presented as the mean ± SEM (n = 4). (B) Boxplot analysis of the sum of isometric tension among all the groups. *P < 0.05 for TB, HC and rCypA groups vs ACh group.
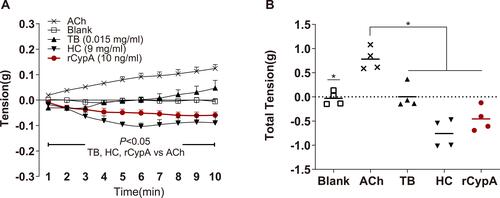
Figure 3 Suppression effects of recombinant CypA on cytokines and immunoglobulins. (A–J) The concentrations of cytokines and immunoglobulins. The unit of each cytokine is described as pg/mL. The unit of each immunoglobulin is described as ng/mL. Data are presented as the mean ± SEM (n = 8). *P < 0.05 vs baseline in the Non-stim group; #P < 0.05 vs baseline in the PWM-stim group. (K) Heatmap of the cytokines profile for Th1, Th2, TNF-α and immunoglobulin in supernatants of lymphocytes.
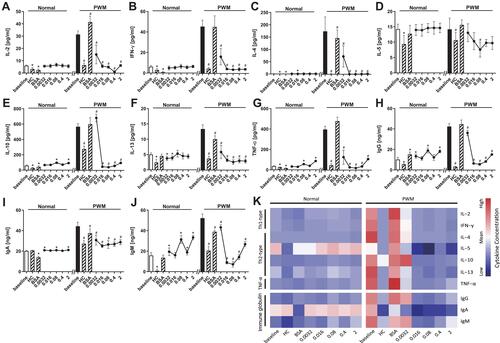
Figure 4 Effects of recombinant CypA on IL-4 and IFN-γ levels in separated CD4+ T cells. (A) The concentrations of IL-4 in different groups. (B) The concentrations of IFN-γ in different groups. The unit of each cytokine is described as pg/mL. Data are presented as the mean ± SEM (n = 4). *P < 0.05, when compared with the Con A group.
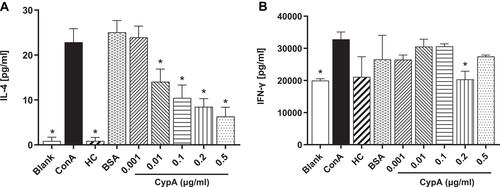
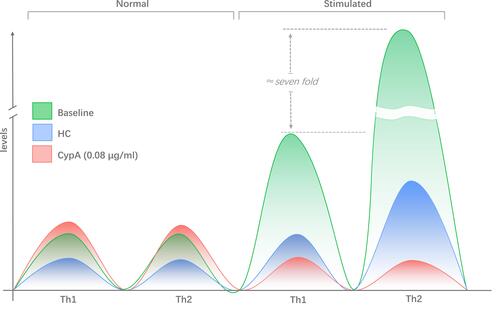
Figure 5 Schematic illustration of the suppressive effect of CypA on the levels of cytokines in the Non-stim and PWM-stim groups. The Y-axis represents an arbitrary measure of cytokines.