Figures & data
Figure 1 Large- and small-airway obstruction in mice representing different airway inflammation models. Airway function in mice was measured using a forced manoeuvres system. (A) FVC showed no difference between the control group and asthma models. (B–D, H) Large-airway function (FEV25, FEV50, FEV75, FEF25) in mice. (E–G) Small-airway function (FEF50, FEF75, MMEF) declined in mouse models of asthma. *P < 0.05, **P < 0.01, ***P < 0.001.
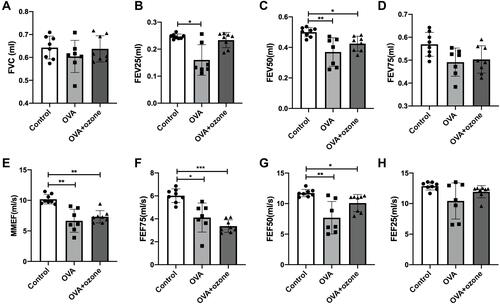
Figure 2 Asthma models exhibited bronchial hyperresponsiveness. (A) The baseline is represented by average lung resistance (RL) value after PBS nebulization (within 2 min) for each mouse. (B) -logPC100 (ACh concentration required to increase RL by 100% from baseline). (C) Mean percentage increase in RL with increasing concentrations of ACh. Data are expressed as mean ± SD. In Panel B, **P < 0.01; in Panel C, *P < 0.05, **P < 0.01, compared with the control group.
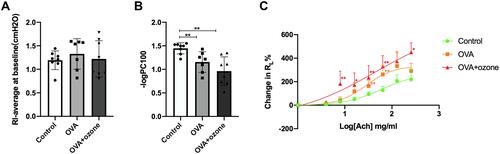
Figure 3 OVA and OVA + ozone–induced asthma models presented prominent airway inflammation and mucus hypersecretion. The infiltration of neutrophils, eosinophils, and lymphocytes, the PAS-positive area and Muc5ac-positive area were determined in a double-blind design by two investigators independently. Muc5ac mRNA in the lungs of mice was measured by RT-qPCR. (A) Representative photomicrographs of hematoxylin and eosin-stained sections of the lung with inflammatory cell infiltration (a typical neutrophil was indicated by a blue arrow and a typical eosinophil was indicated by a red arrow). (B) Representative photomicrographs of the lung with airway mucus production and goblet cell hyperplasia (purple area within tracheal cavity indicated by arrows). (C) Representative photomicrographs of immunohistochemical analysis of Muc5ac in lung tissue slices. (D) Infiltration density of neutrophils, eosinophils and lymphocytes. (E) Airway inflammation scores. (F) PAS-positive area. (G) Percentage of Muc5ac-positive area around the airways. (H) Muc5ac gene expression in lung tissue. (I) Levels of IgE in serum. (J) Total cells in BALF. (K) Macrophages in BALF. (L) Neutrophils in BALF. (M) Eosinophils in BALF. Scale bars represent 100 µm. Data in (E) are expressed as the median, as they did not fit a Gaussian distribution; other data are expressed as the mean ± SD. *P < 0.05, **P < 0.01, ***P < 0.001. Scale bars represent 100 µm.
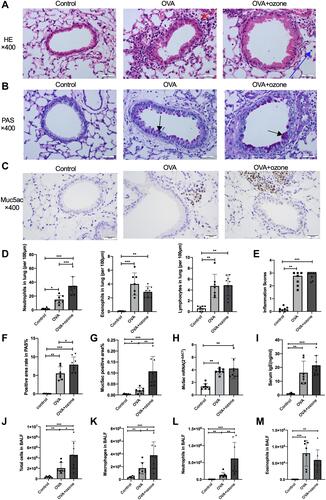
Figure 4 Levels of inflammatory cytokines in the bronchoalveolar lavage fluid (BALF) of asthmatic mouse models were increased. (A) Levels of IL-4 in BALF. (B) Levels of IL-5 in BALF. (C) Levels of IL-13 in BALF. (D) Levels of IL-17A in BALF. (E) Levels of TNF-α in BALF. *P < 0.05, **P < 0.01, ***P < 0.001.
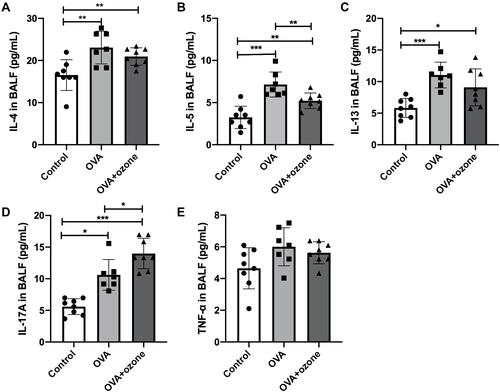
Figure 5 Collagen deposition in the lungs of mouse models of asthma. (A) Representative photomicrographs of Masson’s trichrome stained lung tissue. (B) Percentage of subepithelial Masson stained area (blue area around airways were identified as collagen deposition and were indicated by arrows). ***P < 0.001. Scale bars represent 100 µm.
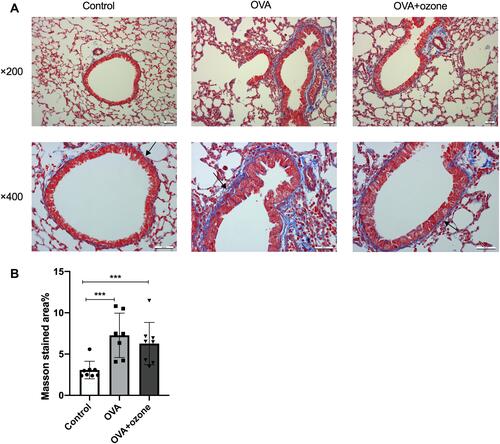
Figure 6 Airway smooth muscle (ASM) mass was increased in OVA + ozone mice. (A) Representative photomicrographs of immunohistochemical analysis of alpha-smooth muscle actin (α-SMA) in lung tissue slices. (B) Percentage of SMA-positive area around the airways. *P < 0.05, **P < 0.01. Scale bars represent 100 µm.
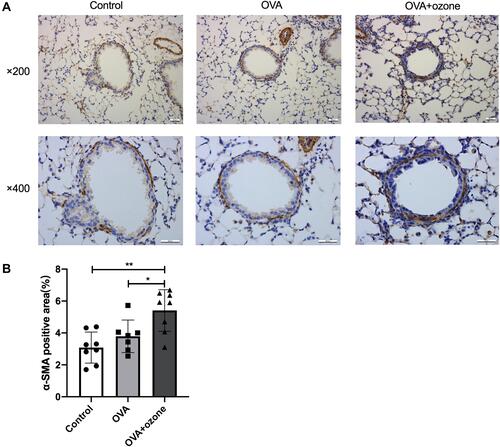
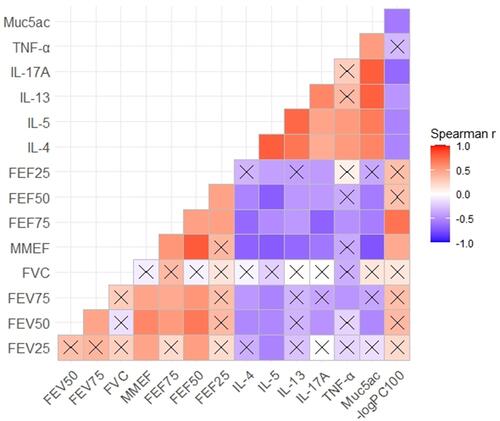
Figure 7 Small-airway function variables were negatively correlated with the levels of inflammatory cytokines in bronchoalveolar lavage fluid (BALF), airway responsiveness, and mucus secretion. A Spearman correlation coefficient matrix was constructed and Spearman rank correlation tests were conducted. A cross indicates no statistical significance.