Figures & data
Table 1 COVID-19-Related Disease Prevention Measures and Policies in Chengdu, China
Figure 1 The number of monthly pediatric asthma patients.
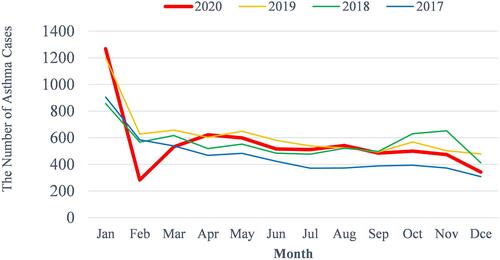
Figure 2 Correlation between the number of pediatric asthma patients and PM2.5 from 2017 to 2019 (*p<0.05).
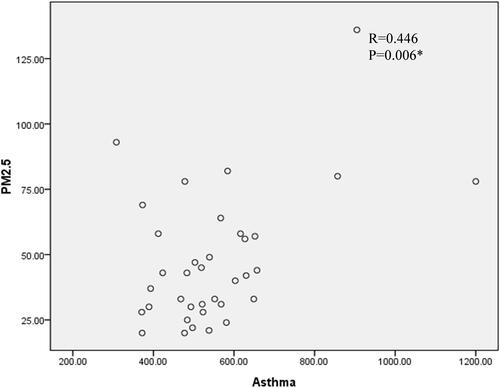
Figure 3 Correlation between the number of pediatric asthma patients and PM10 from 2017 to 2019 (*p<0.05).
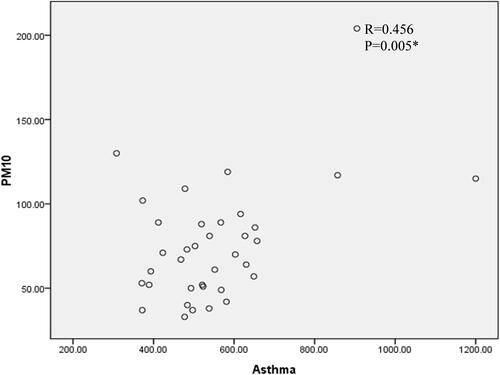
Figure 4 Correlation between the number of pediatric asthma patients and temperature from 2017 to 2019 (*p<0.05).
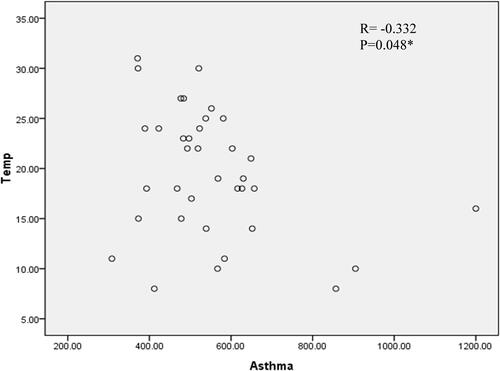
Figure 5 Correlation between the number of pediatric asthma patients and PM2.5 in 2020.
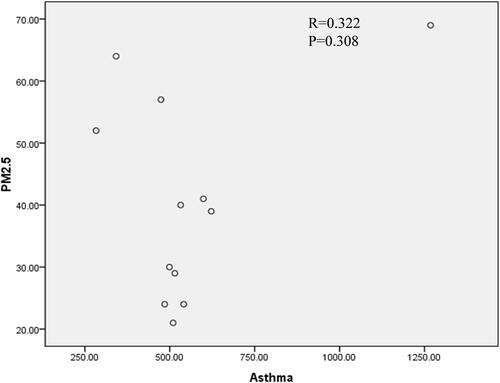
Figure 6 Correlation between the number of pediatric asthma patients and PM10 in 2020.
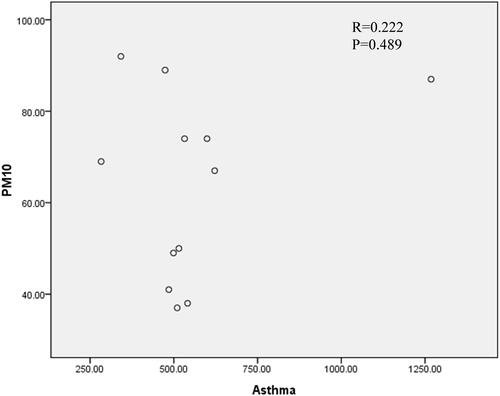
Figure 7 Correlation between the number of pediatric asthma patients and temperature in 2020. (Asthma= the number of pediatric asthma patients, Temp= temperature).
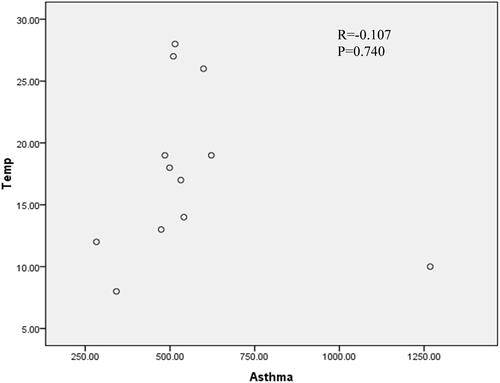
Figure 8 The rate of severe asthma attacks in 2017−2020.
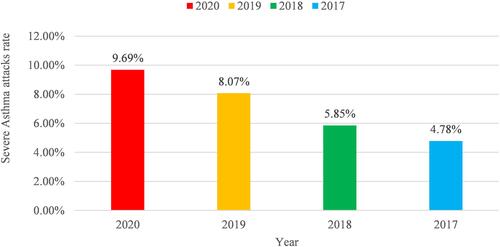
Figure 9 Monthly rate of severe asthma attacks in 2017–2020.
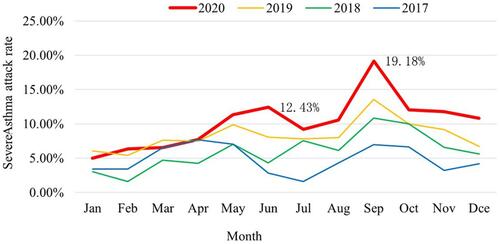
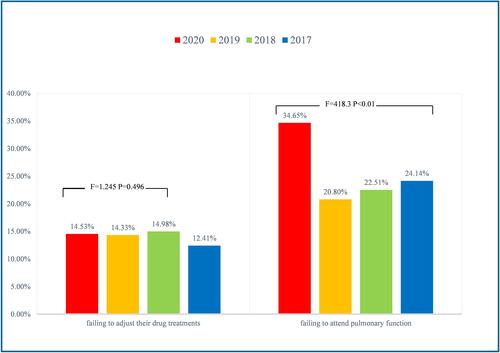
Figure 10 The percentage of patients failing to adjust their drug treatments and attend pulmonary function tests in 2017–2020.