Figures & data
Table 1 Demographic and Clinical Characteristics of Study Subjects
Figure 1 Characterization of the gut microbiota in asthmatic patients. (A) The overall microbial composition was different between asthmatic and healthy groups (Adonis, p = 0.004). (B) Alpha-diversity of the intestinal microbiome was lower in asthmatic patients compared to control subjects by using Shannon indices (p = 0.031). (C) General landscape of gut microbiome in asthmatic patients and control subjects. (D) Differentially abundant bacterial communities between asthmatic patients and healthy control subjects by using LEfSe. (E–I) Species significantly enriched in asthmatic patients (E–G) and healthy controls (H and I) by using Student’s t-test. (J) ROC analysis of the bacterial biomarkers in RF model achieved an AUC of 0.964 to classify asthmatic patients from healthy controls. *, p < 0.05; **, p < 0.01.
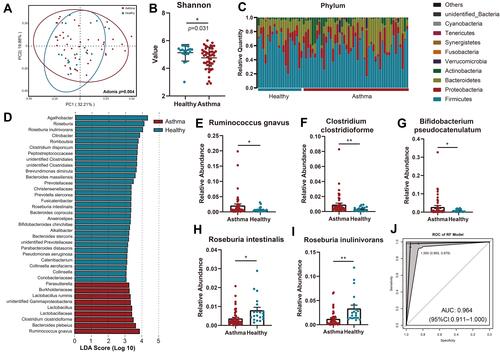
Figure 2 Differences of intestinal microbiome between different asthma endotypes. (A) PLS-DA of intestinal microbiome difference between allergic and non-allergic asthmatic patients (Adonis, p = 0.014). (B and C) Differential species of gut microbiome in allergic, non-allergic asthmatic patients, and healthy controls. (D and E) The AUC of 17 differential species reached 0.953 to predict asthma from healthy controls (D), and 0.967 to distinguish allergic/non-allergic cohort (E). (F and G) Combination of Ruminococcus bromii, Brevundimonas vesicularis and Clostridium disporicum resulted in an AUC of 0.839 to discriminate healthy/asthma cohort (F) and 0.743 in allergic/non-allergic cohort (G). (H and I) Clostridium disporicum was positively correlated with FEV1 (r = 0.2564, p = 0.0362) (H) and FEV1/FVC ratio (r = 0.3237, p = 0.0075), (I). (J and K) Ruminococcus bromii was positively correlated with FENO (r = 0.2475, p = 0.0435) (J) and EOS level (r = 0.2503, p = 0.041) (K).
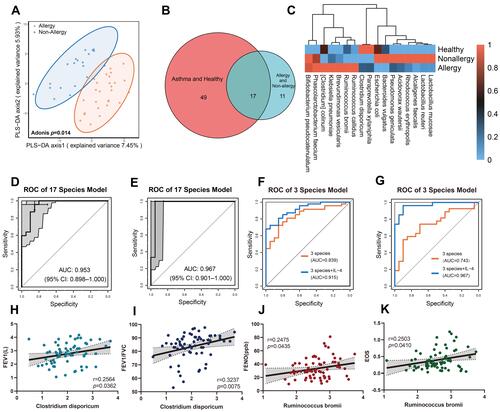
Figure 3 Functional analysis of gut microbiota and their association with asthma. (A) Differential pathways presented in asthmatic and control groups with PICRUSt analysis. (B) Model created by 16 microbiome-encoded pathways showed an AUC of 0.977 to distinguish asthma from healthy controls. (C) Correlation analysis between functional pathways and clinical indexes in asthmatic patients. *, p < 0.05; **, p < 0.01.
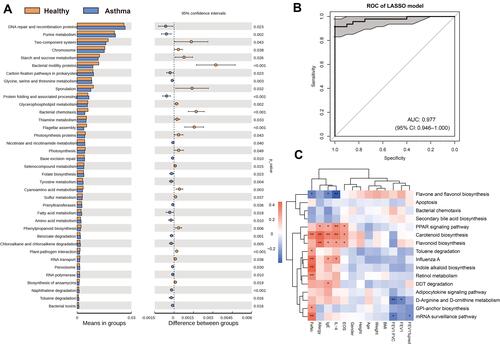
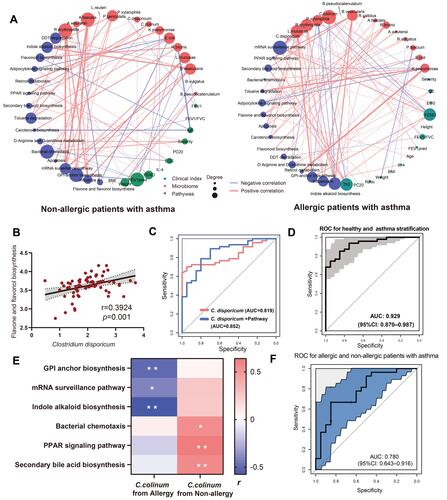
Figure 4 Distinct intestinal microbiotic community to mediate development of different asthma endotypes. (A) Integrated analysis of microbiome, clinical index and functional pathways in asthmatic patients with and without allergic history. (B) Correlation analysis between Clostridium disporicum (C. disporicum) and functional pathway of flavone and flavonol biosynthesis. (C) Clinical performance of C. disporicum and functional pathway for prediction of asthma. (D) Combination of C. disporicum, Flavonoid biosynthesis pathway and serum IL-4 level exhibited an AUC of 0.929 to classify asthmatic patients and healthy controls. (E) Correlation analysis between C. colinum and associated functional pathways. (F) Combination of C. colinum and its associated functional pathways resulted in an AUC of 0.780 to distinguish asthmatic patients with allergic history from non-allergic ones. *, p < 0.05; **, p < 0.01.