Figures & data
Table 1 Subject Characteristics
Figure 1 HPLC profiles of aqueous SF extract, SF-F1, SF-F2, SF-F3, SF-F4. SF-F1 contained water-soluble compounds. SF-F2 contained alkaloids. SF-F3 and SF-F4 contained flavonoids and terpenoids.
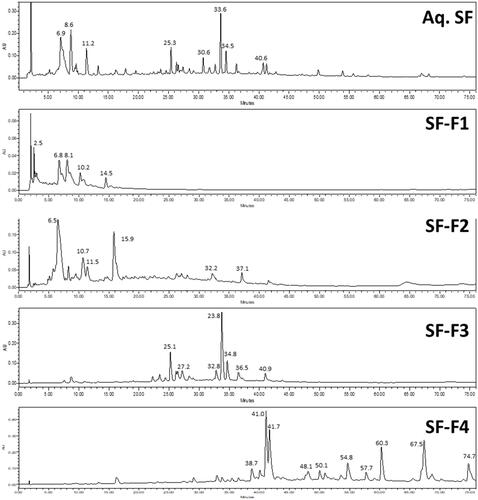
Figure 2 PBMC cytokine production and IL-10/IL-5 ratio between healthy and asthma subjects. PBMCs were stimulated with anti-CD3/28 dynabeads. *p<0.0.05, **p<0.01, ***p<0.001 vs baseline; #p<0.05 (n=11–12).
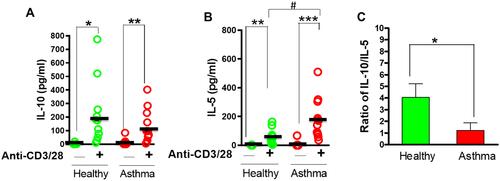
Figure 3 Effect of ASHMI on PBMC cytokine production. IL-10 (A) and IL-5 (B) cytokine production. (C) The ratio of IL-10/IL-5. (D) Percentage of cell viability. *p<0. 0.05, **p<0.1 (n=6).
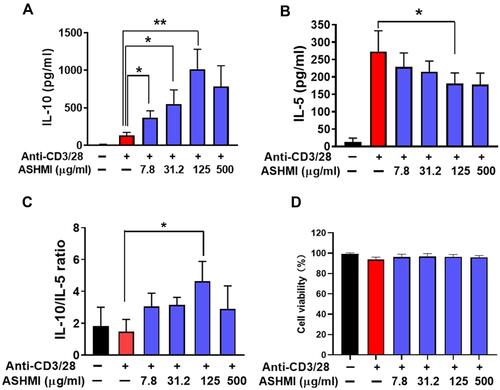
Figure 4 Effect of individual extract of herbal constituents on cytokine production of asthmatic subject PBMCs (n=8). Cytokine production of IL-10 (A) and IL-5 (B). (C) The ratio of IL-10/IL-5 production. *p<0.05, **p<0.1 (n=8-10).
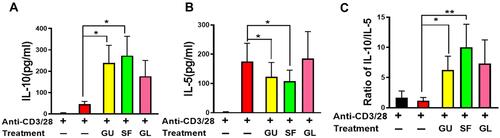
Figure 5 SF-F2 increased IL-10 and SF-F4 suppressed IL-5. (A) SF-F2 increased IL-10 production; (B) SF-F4 suppressed IL-5 production; (C) SF-F2 increased the ratio of IL-10/IL-5. *p<0.05 (n=6-8).
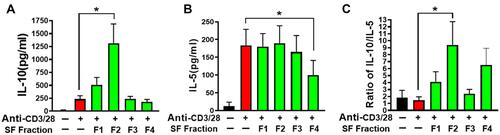
Figure 6 SF-F2 immunomodulation counteracts Dex induced-immune suppression on IL-10. The level of IL-5 (A) and IL-10 (B) were measured. The ratio of IL-10/IL-5 were calculated (C) *P<0.05, **P<0.01, ***P<0.001 (n=5).
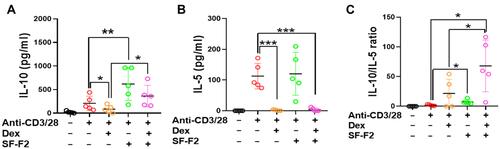
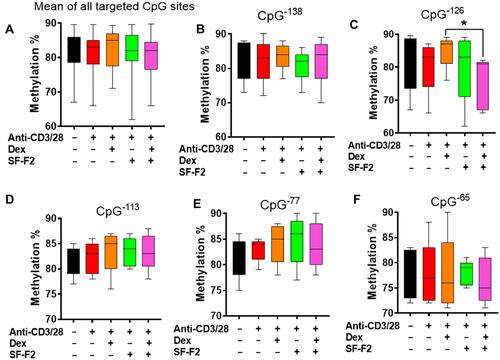
Figure 7 Percent methylation of CpG residues in the FOXP3 gene promoter. Percent methylation of CpG residues in the human foxp3 promoter were assessed by pyrosequencing. *p<0.05 (n=5).