Figures & data
Table 1 Characteristics Background of Patients with Clinical Symptoms of Suspected Allergic Diseases from February to June Between 2017 and 2020 in South China
Figure 1 Adjusted odds ratio of sIgE reactivities to allergens and tIgE reactivity among patients with clinical symptoms of suspected allergic diseases in south China.
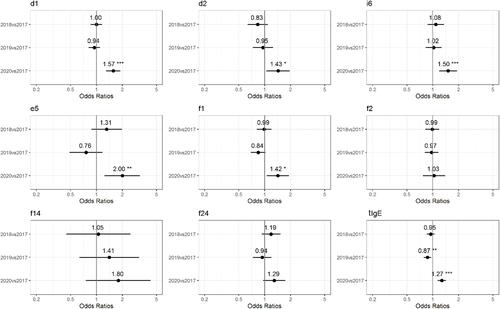
Table 2 Adjusted Odds Ratio of sIgE Reactivities to Allergens and tIgE Reactivity Among Patients with Clinical Symptoms of Suspected Allergic Diseases in Different Genders in South China
Figure 2 Positive rates of sIgE reactivities to allergens and tIgE reactivity of patients with clinical symptoms of suspected allergic diseases in different genders from February to June between 2017 and 2020 in south China.
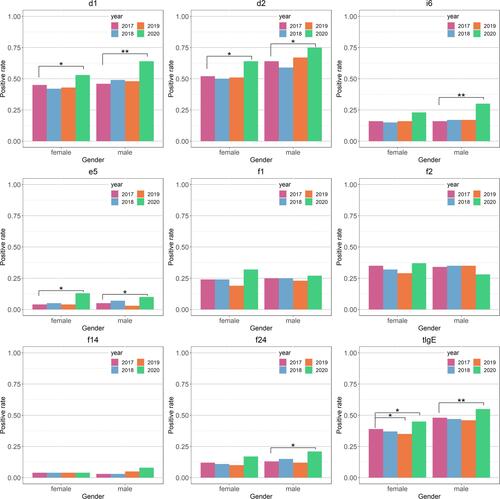
Table 3 Adjusted Odds Ratio of sIgE Reactivities to Allergens and tIgE Reactivity Among Patients with Clinical Symptoms of Suspected Allergic Diseases in Different Age Groups in South China
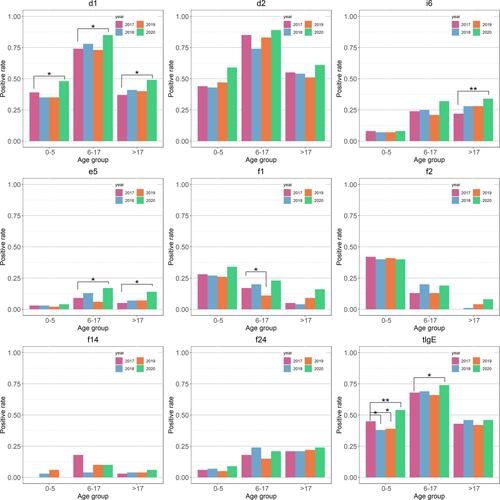
Figure 3 Positive rates of sIgE reactivities to allergens and tIgE reactivity of patients with clinical symptoms of suspected allergic diseases in different age groups from February to June between 2017 and 2020 in south China.