
Figures & data
Figure 1 The ELISA and flow cytometric analysis results. (A) Blood samples were collected and level of serum IgE was measured (n=6). (B) The ration of eosinophils in bronchoalveolar lavage fluid (BALF) in asthmatic mice. *p<0.001 compared to control group.
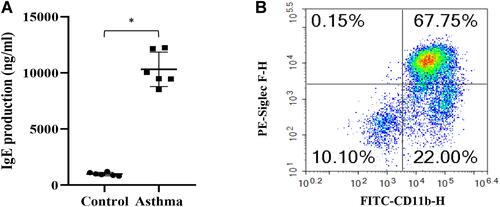
Figure 2 Pathological results of hematoxylin and eosin (HE) staining in the lungs of asthma and control mice. (A) The lung of normal control mice (20×). (B) The lung of normal control mice (40×). (C) The lung of asthmatic mice (20×). (D) The lung of asthmatic mice (20×).
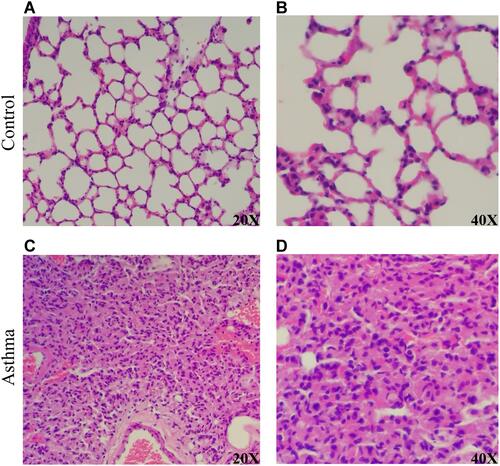
Table 1 Details of the Differential Urinary Proteins in OVA-Induced Asthmatic Mice
Figure 3 Vein diagram of the differential urinary proteins in asthmatic mice compared with control mice.
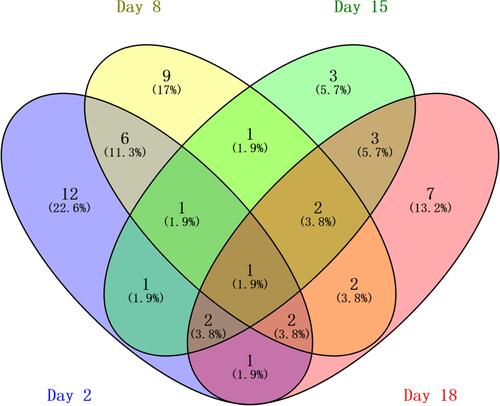
Figure 4 GO analysis of the differential proteins at days 2, 8, 15 and 18 in OVA-induced mice. (A) Biological process; (B) Cellular component; (C) Molecular function.
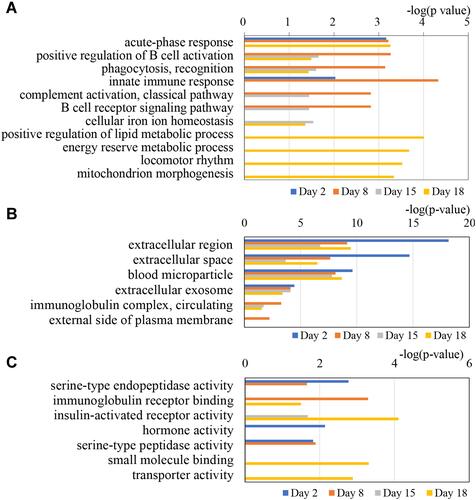
Figure 5 STRING PPI network analysis of the 53 differential proteins in OVA-induced asthma mouse model. The average node degree is 3.84, average local clustering coefficient is 0.443, and PPI enrichment p-value is <1.0e-16.
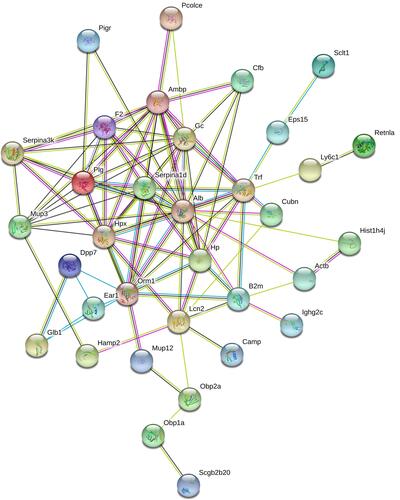
Table 2 Differential Urinary Proteins Related to Asthma