Figures & data
Table 1 Primers for qRT-PCR
Figure 1 Identification of differentially expressed (DE)-miRNAs. (A and B) Volcano plot of differentially expressed miRNAs in two datasets. Many miRNAs are differentially expressed based on analysis of the GSE25230 and GSE.The red dots represent up-regulated miRNAs and the green dots represent down-regulated miRNAs. |FC| > 1.5 and a p value <0.05 are set as the screening criterion (C) Venn diagram of four series. The intersection represents the common DE-miRNAs, the results of which revealed that there were five intersecting miRNAs, including miR-92b-3p, miR-203, miR-124-5p, miR-193a-5p, miR-197-3p, and miR-1246 (D) presentation of identified miRNAs associated with asthma. The red circles represent up-regulated miRNAs and the green circles represent down-regulated miRNAs. (E–J) ROC curve analysis was performed on screened miRNAs using the package pROC. ROC curve of miR-92b-3p (AUC = 0.764, accuracy = 0.692), miR-203 (AUC = 0.727, accuracy = 0.731), miR-124-5p (AUC = 0.661, accuracy = 0.654), miR-193a-5p (AUC = 0.764, accuracy = 0.731), miR-197-3p (AUC = 0.794, accuracy = 0.731), and miR-1246 (AUC = 0.836, accuracy = 0.808).
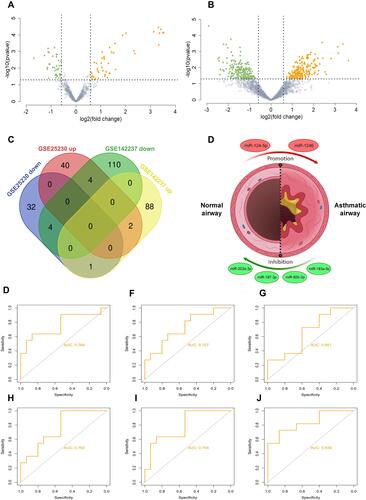
Table 2 miRNA Identified from Two miRNA Datasets
Figure 2 (A) Construction of epithelial miRNA-mRNA regulatory network in asthma. Interaction networks of miRNAs and their predicted target genes. The purple dots represent miRNAs and the green dots represent target mRNAs. (B) PPI network of the target genes constructed with Cytoscape software. Orange dots represent the key Hub genes of Top 10. (C and D) The DE-mRNAs in airway epithelium in normal controls and patients with asthma are presented with a volcano plot, and a heat map was created to show the hierarchical clustering analysis of different expression patterns. The red dots represent up-regulated mRNAs and the green dots represent down-regulated mRNAs. |FC| > 1.5 and a p value <0.05 are set as the screening criterion (E) Venn diagram showing intersection of DE-mRNAs and target genes of identified miRNAs. The intersected region represents the intersection results and 31 genes were intersected in the two groups including 12 genes up-regulated (red) and 19 genes down-regulated (light green) in asthmatics airway epithelium (F) the MiRNA-mRNA regulatory network during asthma progression based on six screened miRNAs and 31 mRNAs. Up-regulated genes are marked in red; down-regulated genes are marked in light green.
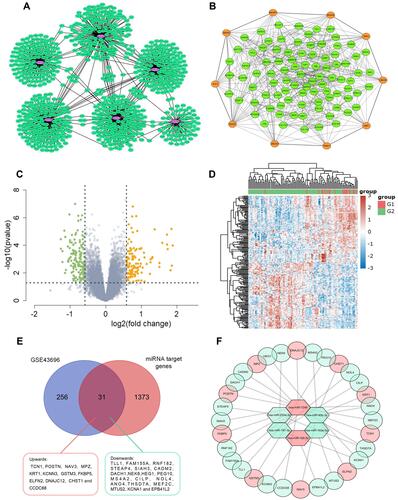
Figure 3 The level of identified miRNAs in asthma-related cellular models. (A) The level of identified miRNAs in IL-13-induced BEAS-2B cells at various concentrations. (B–D) Quantitative reverse transcription-PCR (qRT-PCR) and morphological and immunofluorescence analyses were commonly used to confirm that an airway remodeling/epithelial mesenchymal transition (EMT) cellular model induced by TGF-β1 was successfully constructed. (E) The level of identified miRNAs in TGF-β1-induced BEAS-2B cells at various concentrations. Data are represented as means ± SEMs from 3 independent experiments. *P < 0.05; **P < 0.01.
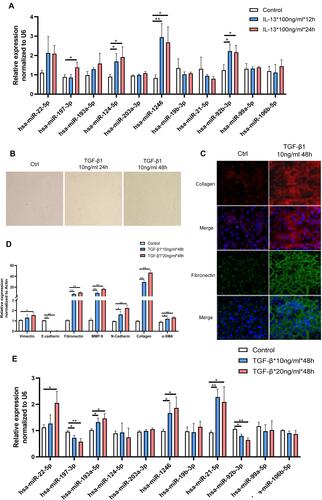
Figure 4 DE-miRNAs in blood samples in patients with asthma and healthy controls. (A) A flow chart for quantification of the selected miRNAs in blood (B) hsa-miR-19b-3p (C) hsa-miR-21-5p (D) hsa-miR-22-5p (E) hsa-miR-92b-3p (F) hsa-miR-99a-5p (G) hsa-miR-106b-5p (H) hsa-miR-124-5p (I) hsa-miR-193a-5p. (J) hsa-miR-197-3p (K) hsa-miR-203a-3p (L) hsa-miR-1246. Data are represented as means±SEMs from 3 independent experiments. *P < 0.05; **P < 0.01.
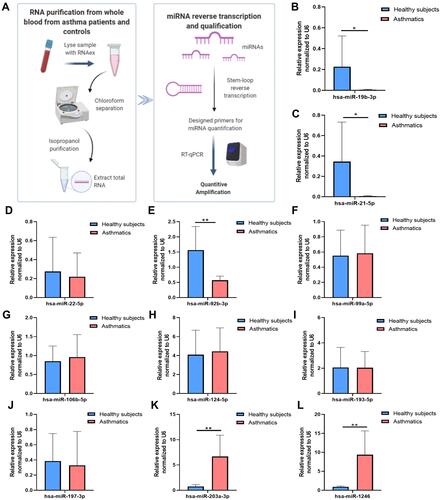
Figure 5 POSTN was a direct target of miR-1246. (A–C) The transfection efficiency was assessed using qRT-PCR and immunofluorescence analysis. (D–H) Five DE-genes (POSTN, THSD7A, SIAH3, DNAJC12, and CADM2) that have relatively high prediction-targeted scores were predicted to interact with miR-1246 using TargetScan and validated by qRT-PCR and the dual-luciferase reporter assay using miR-1246 mimics/inhibitors. Data are represented as means ± SEMs from 3 independent experiments. *P < 0.05; **P < 0.01.
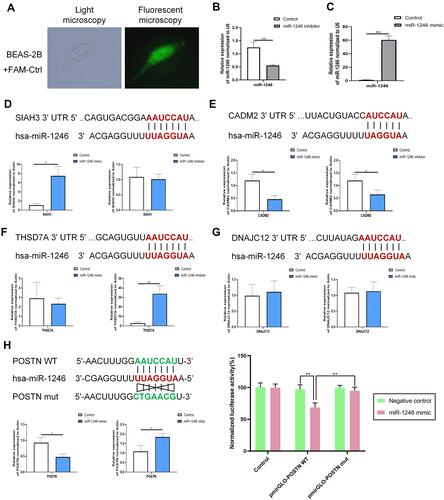
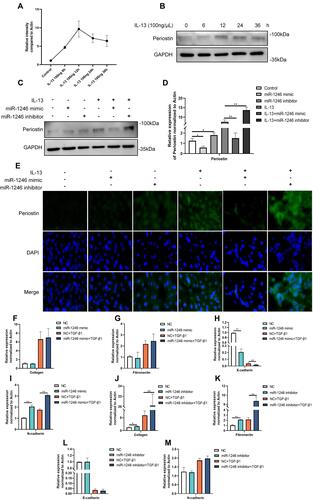
Figure 6 Effects of miR-1246 on POSTN and remodeling. (A) Western blot and qRT-PCR assays were performed to determine the full time-response curve of periostin. The maximum response was observed with 100 ng/mL IL-13 at 12 h. (C–E) The expression of POSTN in BEAS-2B cells transfected with the miR-1246 mimic, miR-1246 inhibitors, or miR-control was measured by Western blot, RT-PCR and immunofluorescence analysis. (F–M) RT-PCR was used to examine the effects of miR-1246 on airway remodeling and EMT using miR-1246 mimics (F–I) and inhibitors (J–M). Similar results were obtained in three independent experiments. *P < 0.05; **P < 0.01.