
Figures & data
Figure 1 Study design.
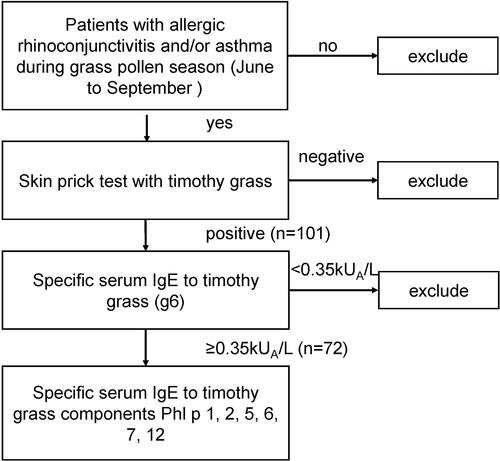
Figure 2 Pollen concentration in three areas. Pollen monitoring was performed by a gravitational method using a modified Durham pollen sampler described by Ye.Citation19
Notes: (A) Daily pollen concentration in BJ (data collected from 01 January to 31 December, 2013), SM (data collected from 01 May to 12 October, 2020) and SZS (data collected from 01 March to 31 October, 2020). (B) Monthly pollen concentration in BJ, SM and SZS. Pollen monitoring was performed from 01 January to 31 December 2013. The concentration of Poaceae pollen refers to the left vertical axis and the concentration of Artemisia, other weed and tree pollens refer to the right vertical axis. The season of Poaceae pollen was from June to September or even October, and overlapped with weed pollen. The Poaceae pollen concentration is much lower than the other three types of pollen. (C) The annual pollen index (API) of Poaceae, Artemisia, other weed and tree pollens. Artemisia is the major type in weed pollens. Compared to the other three types pollen, the API of Poaceae pollen is much lower.
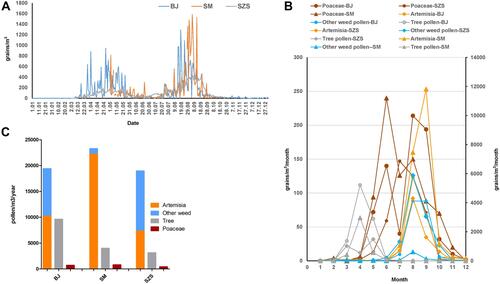
Figure 3 The age distribution of patients.
Notes: 29% of patients were aged 1–6 years, 26% aged 7–12 years and 31% aged 18–45 years.
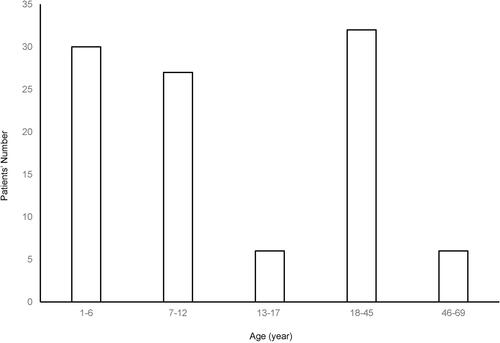
Table 1 Prevalence of Phleum pratense Pollen Components
Table 2 Number of Patients in Relation to IgE Sensitization Pattern to Each Component of Phleum pratense