Figures & data
Figure 1 Research cohort recruitment flowchart. Patients who were clinically confirmed to have allergic rhinitis were screened for cat and dog allergen sensitivities, and a questionnaire about demographic information and visual analog scores (VASs) was given to each patient. After obtaining informed consent from all patients, serum samples from patients were used to further examine the sensitization profiles to common furry animals and cat/dog components.
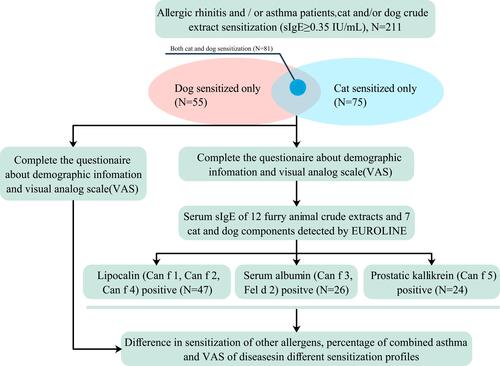
Table 1 Demographic Characteristics of the Participants
Figure 2 Distribution of positive rates of the components (A) and other furry animal crude extracts (B) in dog-sensitized only, cat-sensitized only and both dog and cat double-sensitized patients. Kruskal–Wallis H-test was used to compare the proportion differences between multiple groups. The color shades refers to the percentage of sIgE class 1–5.
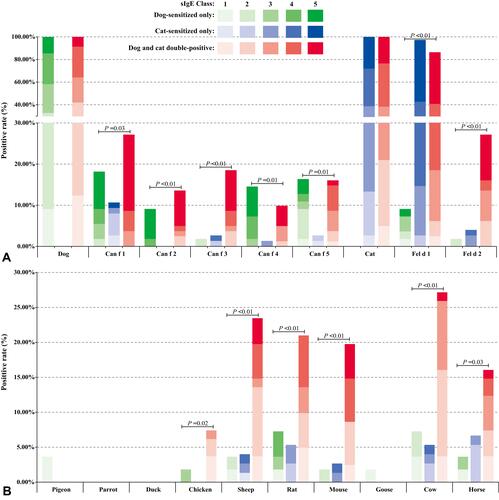
Figure 3 Hierarchical cluster (A) and optimal scale analysis (B) of the connection between components and furry animal crude extracts. Hierarchical clustering analysis, also known as hierarchical cluster analysis, is an algorithm that organizes similar objects into groups called clusters. Optimal scale analysis is a ‘dimensional reduction’ analytical method. Using specific immunoglobulin E levels as categorical variables, the closer the two points of the allergens were, the higher the correlation between the two factors.
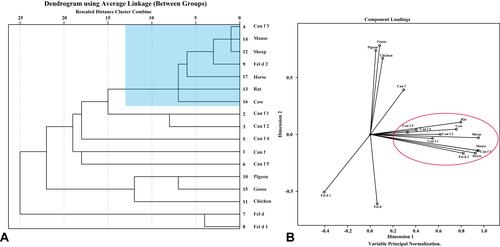
Figure 4 Plot Venn diagrams for serum albumin (A), lipocalin (B), among the three proteins (C), and three proteins link to the extracts from five furry animals (D–F). Core represents the number and proportion of cases where all components are positive.
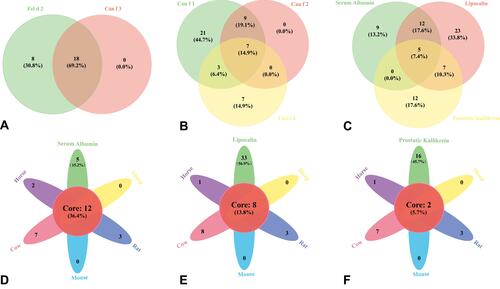
Table 2 The Sensitization Profile of Crude Extracts and Components of Furry Animals Based on the 3 Proteins Sensitization
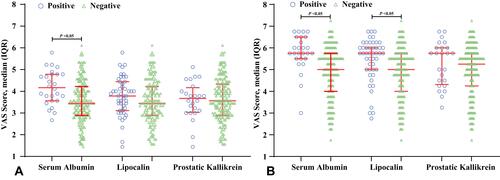
Figure 5(A, B) Differences in VAS scores for symptoms and quality of life in patients with rhinitis. VAS- visual analog scale for serum albumin positive patients means Can f 3 and/or Fel d 2 sensitized. Positive lipocalin indicates sensitization to one or more of Can f 1, Can f 2 and Can f 4 allergens. Prostatic kallikrein positivity is defined as Can f 5 positivity. Mann-Whitney U test was used to compare the distribution difference between the two groups, and P <0.05 was considered statistically significant.