Figures & data
Table 1 Clinical Characteristics of Patients in the Peanut-sIgE Positive and Peanut-sIgE Negative Groups
Figure 1 Percentage of IgE-positive responses to allergen components in the peanut-sIgE positive group and peanut-sIgE negative group. *P < 0.001, †P < 0.05.
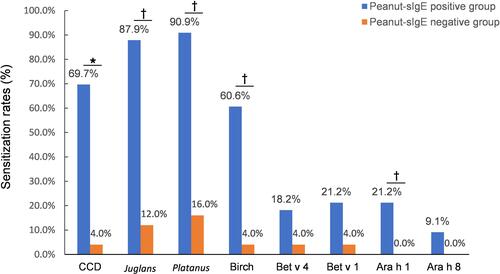
Figure 2 Correlation coefficients of peanut-sIgE antibody levels and sIgE to other pollen allergens and components. The color key indicates Spearman correlation between sIgE to peanut and pollen allergens. The deeper the color, the more relevant it is.
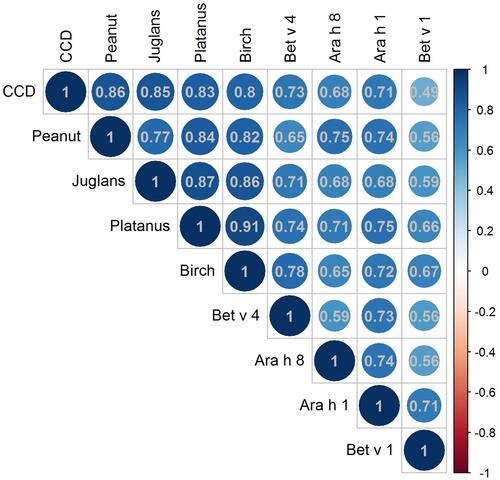
Figure 3 Venn diagram of component co-sensitization among the peanut, Platanus, birch, and Juglans allergens.
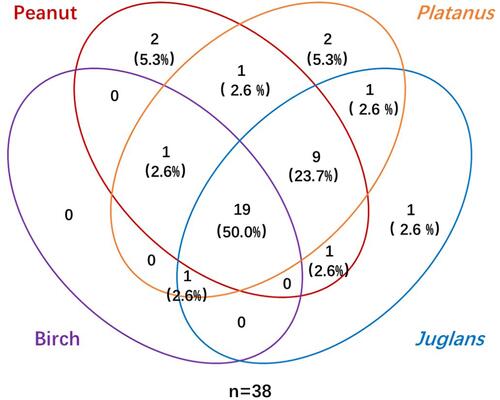
Table 2 Percentages of Patients Sensitized to Peanut Alone or to Both Peanut and Birch Who Tested Positive for Allergens and CCD
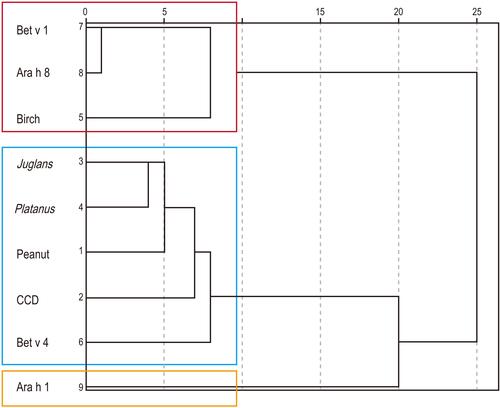
Figure 4 Hierarchical cluster of peanut allergens, pollen allergens, and CCD.