
Figures & data
Table 1 Characteristics of the Study Groups
Table 2 CPET Parameters
Figure 1 Numbers (in boxes) and percentages (x-axis) of children with low O2peak, EIB, VL and physical deconditioning in the two study groups. The number of inactive participants is also presented. Comparisons were performed with chi-square or Fisher’s exact test. *Two children had both EIB and VL.
Abbreviations: EIB, exercise-induced bronchoconstriction; VL, ventilatory limitation.
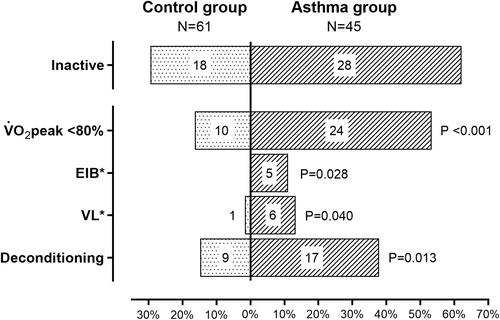
Table 3 Determinants of Cardiopulmonary Exercise Performance*