Figures & data
Table 1 Patient Characteristics
Table 2 The Sequences of Primer Used in qRT-PCR
Figure 1 MAFB was down-regulated in the nasal mucosa of AR patients and AR mouse model. (A) The mRNA levels of MAFB in AR patients (AR, n=20) and healthy individuals (control, n=10). (B) The protein expression of MAFB. (C) The mRNA levels of ZO-1 and occluding. (D) The immunofluorescence staining of CDH26 in nasal mucosa. Scale bar = 50 μm. (E) Experimental protocol of AR mouse model. (F) The mRNA and protein levels of MAFB in nasal mucosa of AR mice with LV-MAFB infection. (G) The immunofluorescence staining of MAFB in nasal mucosa (×400). Scale bar = 50μm. #p<0.05, ##p<0.01.
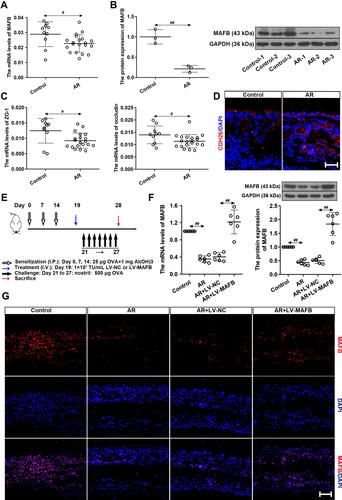
Figure 2 MAFB alleviated the allergic nasal symptoms and inhibited the inflammation of the nasal mucosa induced by OVA. Mice wereintraperitoneally injected with 25 μg OVA and 1 mg aluminum hydroxide gel on days 0, 7, and 14, followed by a nostril challenge with 500 μg OVA from day 21 to day 27. Selected groups of mice were injected with 1×10⁷ TU/mL LV-MAFB into the tail vein of mice 48 h before the nostril challenge on day 19. (A and B) The frequencies of nasal rubbing and sneezing within 15 min. (C and D) The serum concentration of IgE and sIgE. (E–I) The count of total cells, eosinophils, neutrophils, lymphocytes, and monocyte macrophages in NALF. (J–L) The serum concentration of IFN-γ, IL-4, and IL-17A. #p<0.05, ##p<0.01.
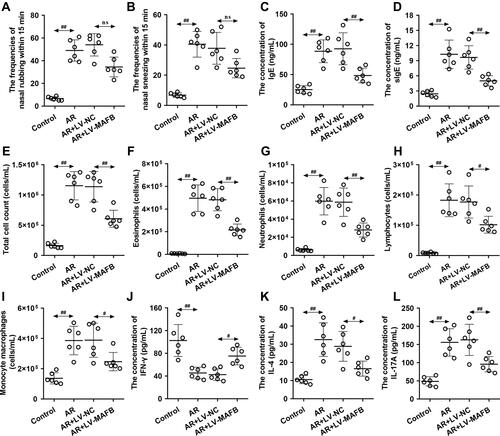
Figure 3 MAFB relieved the histological injuries and dampened the eosinophil and mast cell infiltration of the nasal mucosa induced by OVA. Mice wereintraperitoneally injected with 25 μg OVA and 1 mg aluminum hydroxide gel on days 0, 7, and 14, followed by a nostril challenge with 500 μg OVA from day 21 to day 27. Selected groups of mice were injected with 1×10⁷ TU/mL LV-MAFB into the tail vein of mice 48 h before the nostril challenge on day 19. (A) The H&E-stained nasal mucosa (×200). Scale bar = 100 μm. Black line indicated the epithelial thicknesses. Black arrows indicated the eosinophils. (B) The cell numbers of eosinophils by H&E staining. (C) The Sirius red-stained nasal mucosa (×400). Scale bar = 50μm. Black arrows indicated the eosinophils. (D) The cell numbers of eosinophils by Sirius red staining. (E) The PAS-stained nasal mucosa (×200). Scale bar = 100 μm. Black arrows indicated the goblet cell hyperplasia. (F) Mast cell infiltration was evaluated by immunofluorescence staining (×400). Scale bar = 50 μm. (G) The cell numbers of mast cells. ##p<0.01.
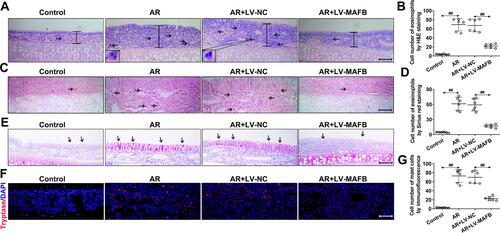
Figure 4 MAFB facilitated the Th1 response and inhibited the Th2 and Th17 responses. Naive CD4+ T cells were infected with LV-MAFB/LV-NC for 24 h, followed by an incubation with plate-bound anti-CD3, anti-CD28, IL-2, IL-4, and anti-IFN-γ for 72 h. (A) In the CD4+ population, the proportion of IFN-γ+ Th1, IL-4+ Th2, and IL-17A+ Th17 cells was measured by flow cytometry. (B) The concentration of IFN-γ, IL-4, and IL-17A in NALF. (C) The protein expression of T-bet, GATA-3, and ROR-γt. ##p<0.01.
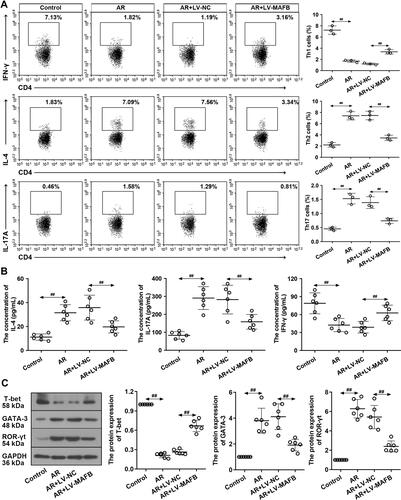
Figure 5 MAFB repressed the Th2 differentiation. Naive CD4+ T cells were infected with LV-MAFB/LV-NC for 24 h, followed by the incubation with plate-bound anti-CD3, anti-CD28, IL-2, IL-4, and anti-IFN-γ for 72 h. (A) The mRNA levels of MAFB. (B) The protein expression of MAFB. (C) The proportion of Th2 cells. (D) The concentration of IL-4 in the supernatant of the Th2 cells. (E) The protein expression of GATA-3. ##p<0.01.
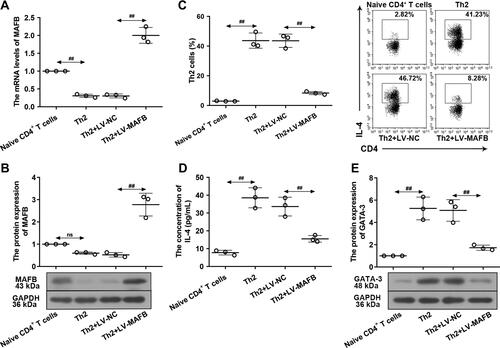
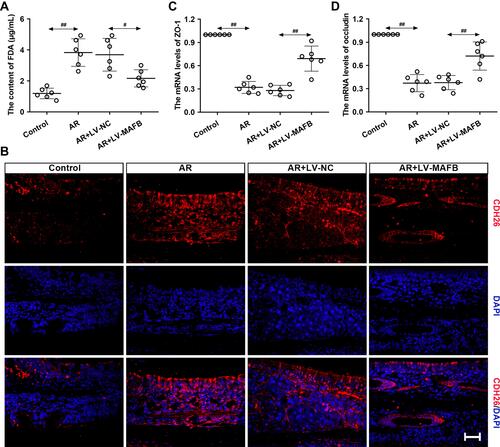
Figure 6 MAFB protected the epithelial barrier integrity of AR mouse induced by OVA. Mice were intraperitoneally injected with 25 μg OVA and 1 mg aluminum hydroxide gel on days 0, 7, and 14, followed by a nostril challenge with 500 μg OVA from day 21 to day 27. Selected groups of mice were injected with 1×10⁷ TU/mL LV-MAFB into the tail vein of mice 48 h before the nostril challenge on day 19. (A) The serum content of FDA. (B) The expression of CDH26 evaluated by immunofluorescence staining (×400). Scale bar = 50 μm. (C and D) The mRNA levels of ZO-1 and occluding in the nasal mucosa of AR mice. #p<0.05, ##p<0.01.