Figures & data
Figure 1 Study periods.a
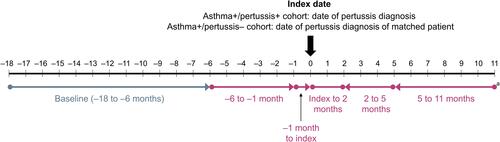
Figure 2 Incidence rate of reported pertussis among individuals with a diagnosis of asthma: overall, by calendar year, and by age group.
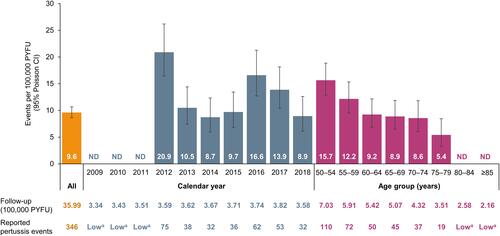
Table 1 Baseline Demographic and Clinical Characteristics for the Matched Cohorts
Table 2 Rates of HCRU per 100 PY (95% CI) in the Asthma+/Pertussis+ and Asthma+/Pertussis– Cohorts During Predefined Periods from –6 Months to +11 Months Around the Index Date
Figure 3 HCRU per 100 PY in the asthma+/pertussis+ and asthma+/pertussis– cohorts during (A) –1 month to index and (B) index to 2 months.
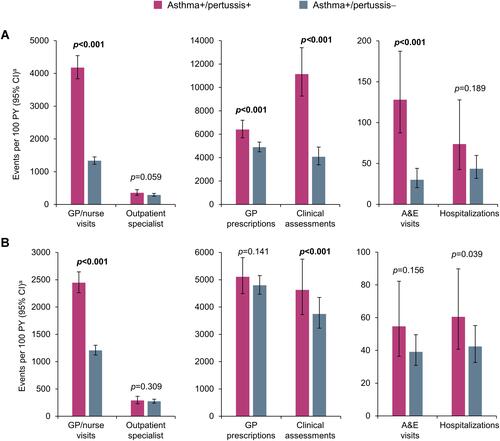
Table 3 Use of the Five Most Common Prescriptions (in the Asthma+/Pertussis+ Cohort During Each Time Period) in the Asthma+/Pertussis+ and Asthma+/Pertussis– Cohorts During Each Time Period Around the Index Date
Figure 4 Mean monthlya all-cause HCRU in the asthma+/pertussis+ and asthma+/pertussis– cohorts from –18 months to 11 months around the index date (pertussis diagnosis): (A) GP/nurse visits; (B) GP prescriptions; (C) outpatient specialist visits; (D) A&E visits; and (E) hospitalizations.
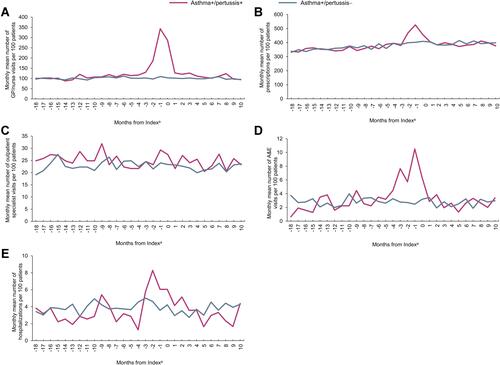
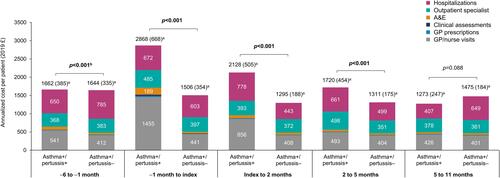
Figure 5 Annualized per-patient DMCa in the asthma+/pertussis+ and asthma+/pertussis– cohorts during the various time periods of the study.