Figures & data
Table 1 The Demographic and Clinical Characteristics of Subjects
Figure 1 CRSwNP tissue specimens H&E staining and tissue eosinophil counts in HPF. (A and B) Typical histological figures of neCRSwNP and eCRSwNP. (C and D) The eosinophils counts and percentages were significantly higher in eCRSwNP patients than neCRSwNP. ***p < 0.001.
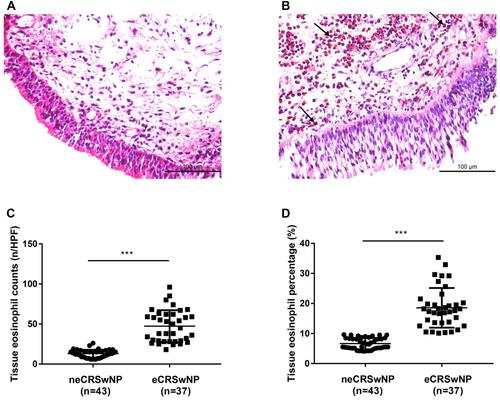
Table 2 Correlation Between Serum YKL-40 and Clinical Variables in CRSwNP Patients
Table 3 Logistic Regression Analysis of Factors Associated with CRSwNP Phenotypes
Table 4 ROC Analysis Results of Different Variables for Distinguishing CRSwNP Phenotypes
Figure 2 Comparison of serum YKL-40 level between HC and CRSwNP. (A) Serum YKL-40 levels were elevated in the CRSwNP than HC. (B) Serum YKL-40 levels were significantly increased in the eCRSwNP than HC and neCRSwNP. *p < 0.05; **p < 0.01.
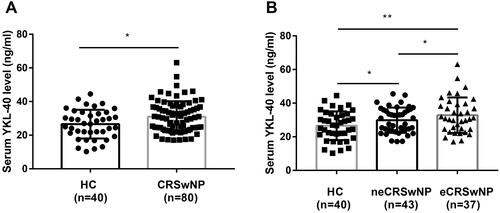
Figure 3 Receiver operating characteristics curves of serum YKL-40 level (red line), blood eosinophil counts (purple line), and blood eosinophil percentage (green line).
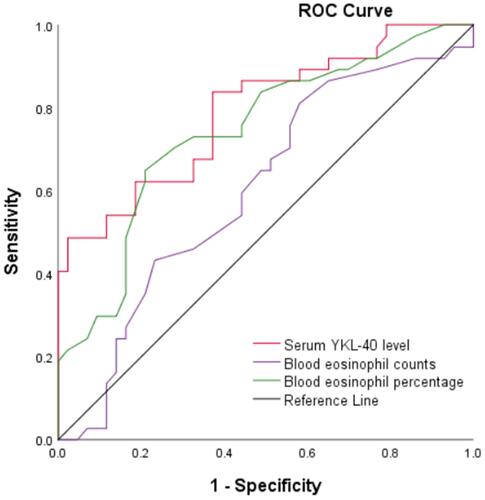
Table 5 Demographic Characteristics Between Primary and Recurrent CRSwNP Patients
Table 6 Logistic Regression Analysis of Factors Affected the Rate of Recurrence in CRSwNP Patients
Table 7 ROC Analysis Results of Indicators for Predicting the Recurrence of CRSwNP
Figure 4 Comparison of serum YKL-40 level between CRSwNP and recurrent CRSwNP. (A) Serum YKL-40 levels were distinctly higher in the rCRSwNP than CRSwNP. (B) Serum YKL-40 levels were significantly increased in recurrent eCRSwNP compared with primary neCRSwNP, primary eCRSwNP, and recurrent neCRSwNP. *p < 0.05; **p < 0.01. ns, not significant.
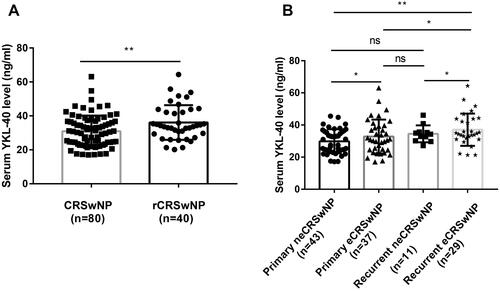
Figure 5 Receiver operating characteristics curves of serum YKL-40 level (green line), tissue eosinophil counts (blue line), blood eosinophil percentage (red line), and tissue eosinophil percentage (orange line).
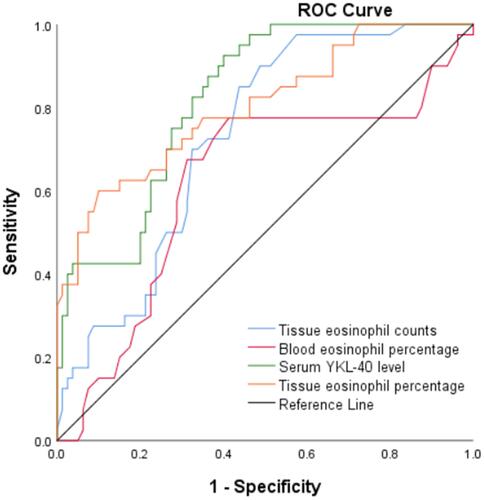
Figure 6 The mRNA expression levels of YKL-40 in the tissue of CRSwNP patient and health controls. The mRNA expression levels of YKL-40 among healthy controls, eCRSwNP and neCRSwNP patients. (A) The mRNA expression levels of YKL-40 in primary CRSwNP and recurrent CRSwNP patients. (B) *p < 0.05, **p < 0.01, ****p < 0.0001. ns, not significant.
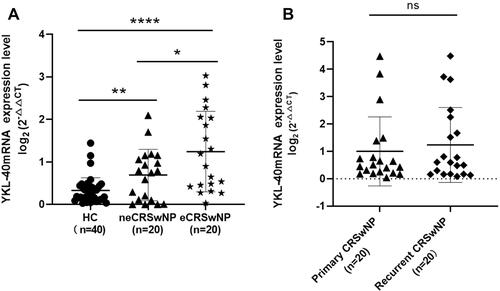
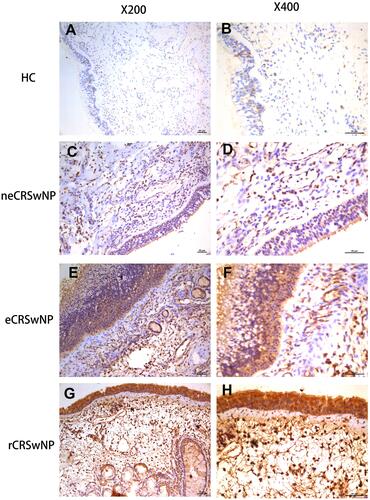
Figure 7 Immunohistochemical staining of YKL-40 in HC, eCRSwNP, neCRSwNP and rCRSwNP patients. (×200 and ×400 magnification). (A and B) HC group. (C and D) neCRSwNP group. (E and F) eCRSwNP group. (G and H) rCRSwNP group.