Figures & data
Figure 1 Consort diagram. Data from intervention groups included in blue box were included in the analysis of change in patient-reported outcome.
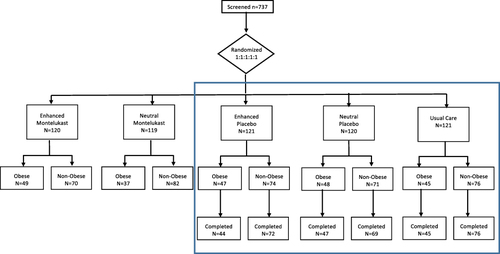
Table 1 Baseline Characteristics
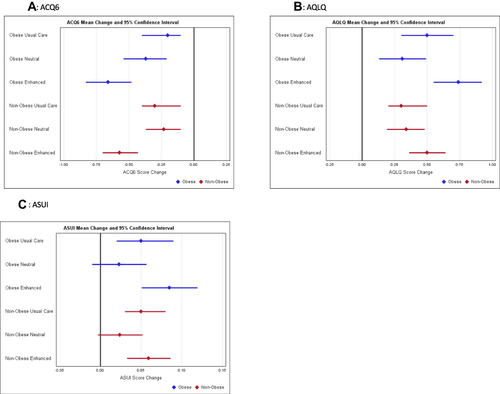
Figure 2 Change in scores by intervention group and obesity status, mean and 95% confidence intervals by messaging and obesity for (A) ACQ6, (B) AQLQ and (C) ASUI. Estimates of change from baseline values at two visits (2 and 4 weeks post randomization) from linear regression, mixed effects models.