Figures & data
Table 1 Clinical Characteristics of Subjects
Figure 1 The expression of PTPRH was increased in asthma subjects and further increased after ICS treatment for four weeks. (A) The protein levels of PTPRH in serum of asthma subjects (n = 85) and healthy controls (n = 33) were determined by ELISA. (B) The ROC curve of PTPRH in serum. (C) The transcript levels of PTPRH in sputum cells of asthma subjects (n = 33) and healthy controls (n = 16) were determined by qRT-PCR. (D) The ROC curve of PTPRH in induced sputum cells. (E) The protein levels of PTPRH in sputum supernatant of asthma subjects (n = 100) and healthy controls (n = 29) were determined by ELISA. (F) The ROC curve of PTPRH in sputum supernatant. (G) The protein levels of PTPRH in sputum supernatant of asthma subjects before and after treatment (n = 26). *p < 0.05; **p < 0.01.
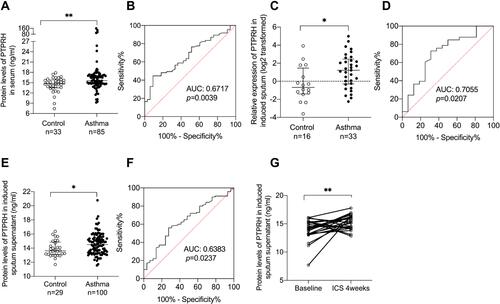
Figure 2 PTPRH protein levels were associated with Th2 asthma. Spearman’s rank order correlation assay between PTPRH protein levels in induced sputum supernatant and (A) IL-4 (n = 70). (B) IL-5 (n = 70). (C) IL-13 (n = 70) and (D) INF-γ (n = 58). Spearman’s rank order correlation assay between PTPRH protein levels in induced sputum supernatant and (E) POSTN (n = 79). (F) SERPINB2 (n = 79) and (G) MUC5AC (n = 60). Healthy controls are presented as circles, and asthma subjects are presented as dots.
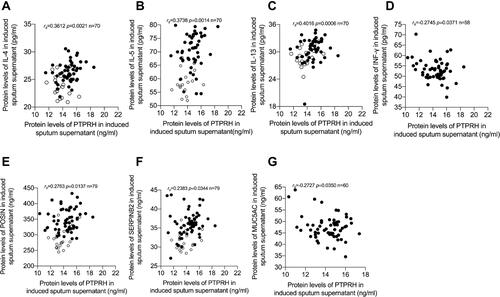
Figure 3 PTPRH protein levels in induced sputum supernatant were associated with pulmonary function parameters. Spearman’s rank order correlation assay between PTPRH protein levels in induced sputum supernatant and (A) FEV1/FVC, (B) FEV1% pred, (C) PEF% pred, (D) MEF% pred, (E) MEF25% pred, (F) MEF50% pred, (G) MEF75% pred. Healthy controls are presented as circles, and asthma subjects are presented as dots.
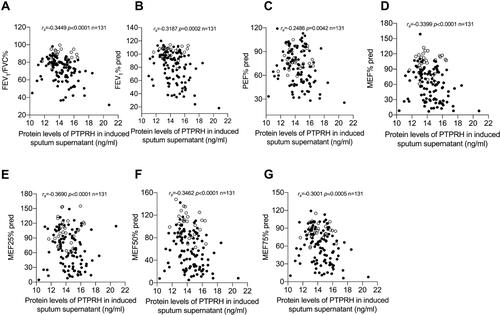
Figure 4 PTPRH mRNA levels of induced sputum cells in asthma subjects were associated with pulmonary function parameters. Spearman’s rank order correlation assay between transcript levels of PTPRH in sputum cells of subjects with asthma and pulmonary function parameters (n = 33): (A) FEV1/FVC, (B) PEF% pred, (C) MEF% pred, (D) MEF25% pred, (E) MEF50% pred, (F) MEF75% pred. (G) The transcript levels of PTPRH in sputum cells correlate with the protein levels of PTPRH in sputum supernatant.

Figure 5 The effect of PTPRH on EGFR and MUC5AC in HBECs. The transcript levels of EGFR and MUC5AC after transfection with empty or PTPRH over-expression plasmid with or without IL-13 stimulation were detected by qRT-PCR. The transcript levels are expressed as log2 transformed and relative to the mean of control group. Data are mean ± SD, **p < 0.01; ***p < 0.001; ****p < 0.0001.
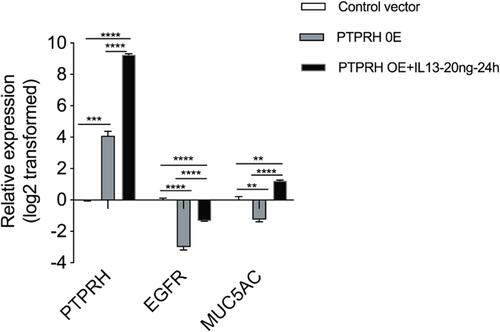
Figure 6 PTPRH suppresses Muc5ac and airway inflammation in asthma model. (A) Flow charts of the HDM-induced asthma mouse model. (B) Hematoxylin and eosin -stained lung tissue sections. (Scale bar: 50 μm; original magnification: ×400; n = 4–5).(C) Cell counting for eosinophils, neutrophils, macrophages and lymphocytes in BALF. n =4–5 mice per group.(D) The transcript levels of Ptprh in lung tissues were detected by qRT-PCR. (E) The transcript levels of inflammatory cytokines in lung tissues were detected by qRT-PCR. (F)PAS-stained lung tissue sections. (Scale bar: 50 μm; original magnification: ×400; n = 4–5). Data are mean ± SD. *P < 0.05; **P < 0.01; ***P < 0.001, ****p < 0.0001 (one-way ANOVA followed by Tukey’s multiple comparison test). The data are representative of three independent experiments.
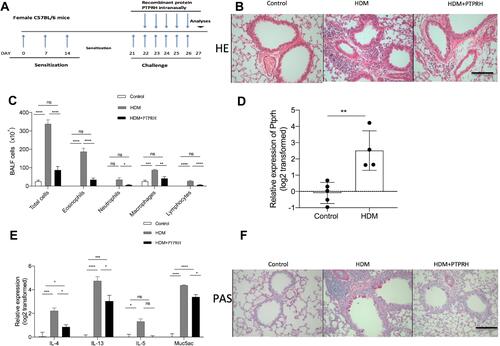
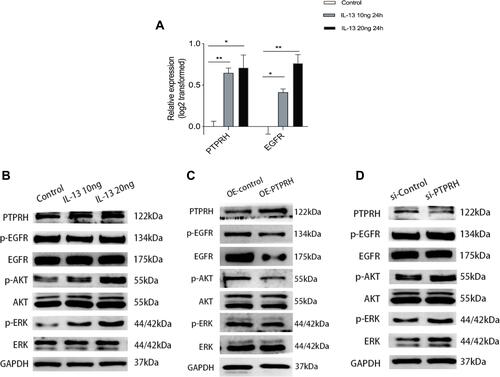
Figure 7 The expression of PTPRH was induced by cytokine IL-13 and the effect of PTPRH on EGFR, ERK1/2, and AKT in HBECs. (A) The transcript levels of PTPRH and EGFR with or without IL-13 stimulation were detected by qRT-PCR. (B) The protein expression in HBECs with or without IL-13 stimulation were detected by Western blotting. (C) The protein expression in HBECs transfected with empty or PTPRH over expression vector were detected by Western blotting. (D) The protein expression in HBECs transfected with empty or PTPRH siRNA were detected by Western blotting. The transcript levels are expressed as log2 transformed and relative to the mean of control group. Data are mean ± SD. *p < 0.05; **p < 0.01.