Figures & data
Figure 1 Bioinformatics analysis predicts putative FA-related genes. (A) Volcano plot of DEGs in DCs sourced from 12 FA samples and 3 control samples in the GSE159706 dataset. (B) Venn diagram showing the overlap of the RBP of MALAT1 predicted using the ENCORI database with the DEGs in GSE117898. (C) Heatmap of 5 candidate RBPs in the GSE117898 dataset. (D) Heatmap of pro-inflammatory factors and anti-inflammatory factors in the GSE159706 dataset.
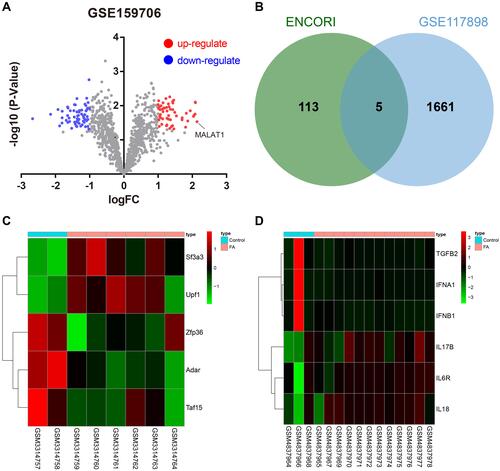
Figure 2 Silencing of MALAT1 affects FA symptoms in the modeled mice. (A) RT-qPCR quantification of MALAT1 expression levels in jejunal tissue samples of mice (n = 10, *p < 0.05 vs the control group). (B) RT-qPCR quantification of sh-MALAT1 silencing efficiency (*p < 0.05 vs the sh-NC group). (C) RT-qPCR quantification of MALAT1 expression levels in jejunal tissues of mice in each treatment group (*p < 0.05 vs the model group). (D) Number of mice with diarrhea. (E) Relative rectal temperature of mice. (F) ELISA to measure serum-specific IgE and IgG1 levels in mice. (G) ELISA to measure Th2 cytokines (IL-4, IL-5, and IL-13), and Th1 cytokine IFN-γ. (H) Representative H&E staining images showing inflammatory cell infiltration (shown by stars) in jejunal tissues. (I) Flow cytometric quantification of eosinophils and monocytes (left) observed by HE staining and mast cells (right) observed by Toluidine blue staining (in panels (D–I), *p < 0.05 vs the control group, #p < 0.05 vs the model + sh-NC group, n = 10). All cellular experiments were repeated 3 times independently.
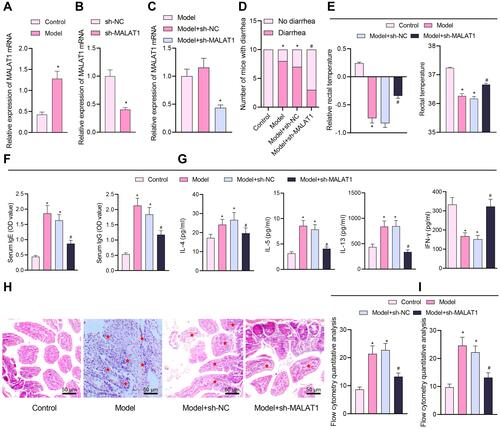
Figure 3 Silencing of MALAT1 induces IL-10 and TGF-β secretion by Tregs in FA mice. (A) Flow cytometry detection of the proportion of CD4+CD25+Foxp3+ cells in mouse splenocytes. (B) Results showing the proportion of CD4+CD25+Foxp3+ cells in mouse splenocytes. (C) Immunofluorescence detection of Foxp3+ cells (green fluorescence) in jejunal tissues (blue fluorescence indicates DAPI staining and red arrows indicates the localization of representative Foxp3+ cells, scale bar = 20 μm). (D) Proportion of Foxp3+ cells. (E) Representative Western blot bands of Foxp3, IL-10, and TGF-β in mouse jejunal tissues. (F) Foxp3, IL-10, and TGF-β protein expression in mouse jejunal tissues. (G) ELISA detection of IL-10 level in mouse splenocyte supernatant. (H) ELISA detection of TGF-β level in mouse splenocyte supernatant. (I) ELISA detection of IL-17 level in mouse splenocyte supernatant. *p < 0.05 vs the control group, #p < 0.05 vs the model + sh-NC group. All cellular experiments were repeated 3 times independently.
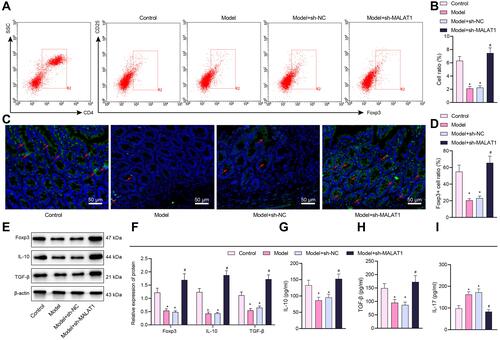
Figure 4 Effect of silencing or overexpression of MALAT1 on the maturation and IL-6 secretion of DCs. (A) RT-qPCR quantification of ZFP36 expression in mouse-sourced DCs. (B) Western blot assay to measure ZFP36 protein expression in mouse-sourced DCs. (C) ELISA to measure IL-12 levels in DC supernatant. (D) ELISA to measure IL-6 levels in DC supernatant. (E) Expression of CD83 and CD86 in DCs determined by flow cytometry (in panels (A–E), n = 10, *p < 0.05 vs the control group, #p < 0.05 vs the model + sh-NC group). (F) Overexpression efficiency of oe-MALAT1 determined by RT-qPCR (*p < 0.05 vs the oe-NC group. (G) Expression of MALAT1 and ZFP36 in DCs determined by RT-qPCR. (H) ZFP36 protein expression in DCs quantified by Western blot analysis. (I) IL-12 level in DC supernatant by ELISA. (J) IL-6 level in DC supernatant by ELISA. (K) Expression of CD83 and CD86 in DCs by flow cytometry (in panels (G–K), *p < 0.05 vs the DCs group, #p < 0.05 vs the DCs + ox-LDL + oe-NC group). All cellular experiments were repeated 3 times independently.
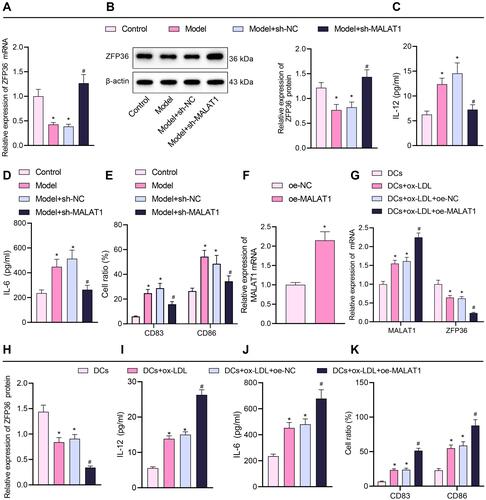
Figure 5 Effect of overexpressed ZFP36 on IL-6 secretion in DCs. (A) Transfection efficiency of oe-ZFP36 in DCs determined by RT-qPCR (*p < 0.05 vs the oe-NC group). (B) ZFP36 expression in DCs determined by RT-qPCR. (C) ZFP36 protein band in DCs detected by Western blot analysis. (D) ZFP36 protein level in DCs determined by Western blot analysis. (E) ELISA to measure IL-12 expression levels in DC supernatant. (F) ELISA to measure IL-6 expression in DC supernatant. (G) Expression of CD83 and CD86 in DCs measured by flow cytometry. (H) CD83 and CD86 expression in DCs measured by flow cytometry (in panels (B–H), *p < 0.05 vs the DCs group, #p < 0.05 vs the DCs + ox-LDL + oe-NC group). All cellular experiments were repeated 3 times independently.
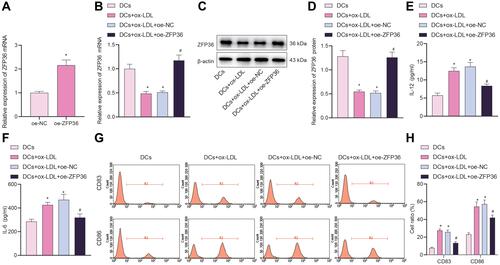
Figure 6 MALAT1 promotes IL-6 secretion from DCs and inhibits Treg immunomodulatory function by downregulating ZFP36 expression to facilitate FA. (A) RT-qPCR to determine MALAT1 expression levels in FA mouse jejunal tissue samples. (B) RT-qPCR to determine ZFP36 expression levels in FA mouse jejunal tissue samples. (C) Number of mice with diarrhea. (D) Relative rectal temperature of mice. (E) ELISA to measure serum-specific IgE and IgG1 levels in mice. (F) ELISA to measure IL-12 and IL-6 expression in DC supernatant. (G) Determination of CD83 and CD86 expression levels in DCs by flow cytometry. n = 10, *p < 0.05 vs the control group, #p < 0.05 vs the model and model + oe-NC group. All cellular experiments were repeated 3 times independently.
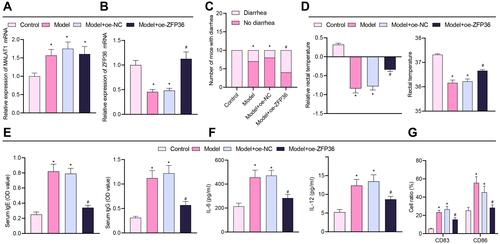
Figure 7 MALAT1 aggravates FA by promoting release of IL-6 from DCs and inhibiting Treg immunomodulatory function through downregulation of ZFP36. (A) Representative H&E staining images of mouse jejunal tissues to observe inflammation and flow cytometric quantification of eosinophils and monocytes. (B) Flow cytometry quantification of mast cells observed by Toluidine blue staining. (C) CD4+CD25+Foxp3+ cell ratio in mouse splenocytes. (D) Immunohistochemical detection of Foxp3+ cell ratio in mouse jejunal tissues. (E) ELISA to measure IL-10 and TGF-β expression levels in mouse splenocyte supernatant (in panels (B–E), n = 10, *p < 0.05 vs the control group, #p < 0.05 vs the model + oe-NC group). All cellular experiments were repeated 3 times independently.
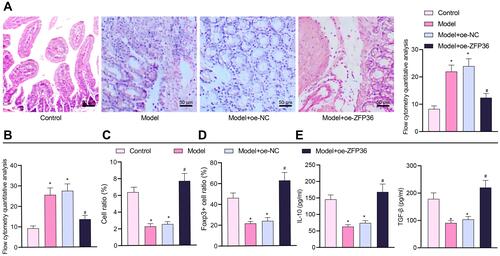
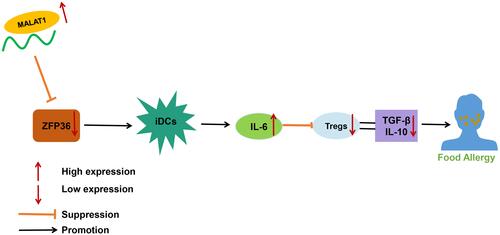
Figure 8 Molecular mechanism of MALAT1-mediated ZFP36 affecting the immunomodulatory function of DCs and Tregs in FA.