Figures & data
Table 1 Baseline Characteristics of Patients with Mild and Moderate-to-Severe Allergic Asthma
Table 2 Serum Cytokine Levels in Mild and Moderate-to-Severe Allergic Asthma Patients
Figure 1 Serum cytokine concentrations of the most discriminative biomarkers (A) IL-23 and IL-31, (B) eotaxin-1 and eotaxin-2, (C) MCP-1, MCP-2 and MCP-3, (D) YKL-40 and TRAIL in mild and moderate-to-severe allergic asthmatics. *P<0.05; **P<0.01; ***P<0.001.
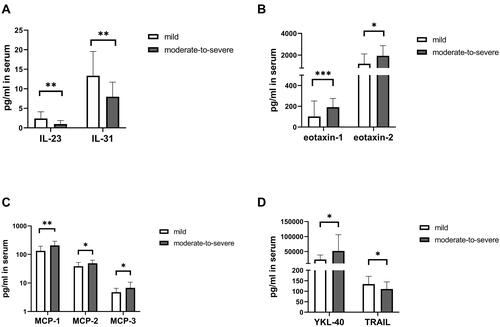
Figure 2 Correlation matrix for 9 discriminative biomarkers with all 33 cytokines tested. Blue represented a negative correlation index while red represented a positive one. The darker the color, the higher the correlation index was.
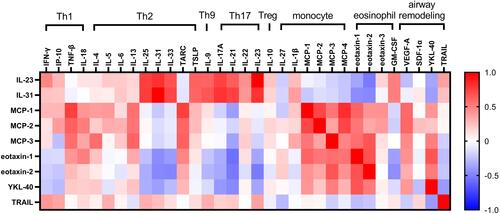
Figure 3 Receiver operating characteristic (ROC) curves of YKL-40, eotaxin-1, MCP-1, IL-23, IL-31, eotaxin-2, MCP-2 and MCP-3 for discriminating mild and moderate-to-severe allergic asthmatics.
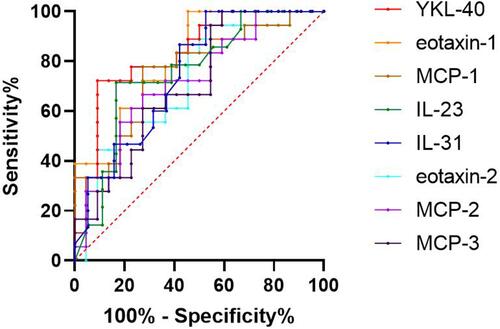
Table 3 The AUC, Cut-off, Sensitivity and Specificity Values for Mild and Moderate-to-Severe Allergic Asthma Patients
Table 4 Correlations Between Cytokine Levels and Lung Function Parameters
Figure 4 Correlation matrix for lung function parameters with all 33 cytokines tested. Blue represented a negative correlation index while red represented a positive one. The darker the color, the higher the correlation index was.
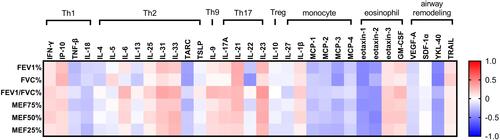
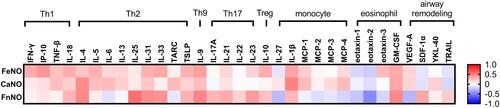
Table 5 Correlations Between Serum Cytokine Levels and Exhaled Nitric Oxide Levels
Figure 5 Correlation matrix for FeNO, CaNO and FnNO levels with all 33 cytokines tested. Blue represented a negative correlation index while red represented a positive one. The darker the color, the higher the correlation index was.