Figures & data
Table 1 Patient Demographics of the Entire Study Population (n = 53) or According to Treatment Received (n = 59 Courses of Therapy)
Figure 1 Changes in ACQ-5 scores over time for patients receiving (A) mepolizumab and benralizumab and (B) omalizumab. ****p < 0.0001.
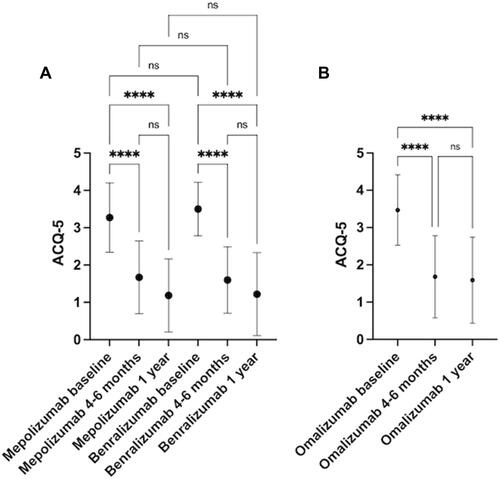
Figure 2 Changes in raw PEFR and FEV1 scores over time for patients receiving (A and C) mepolizumab and benralizumab and (B and D) omalizumab.
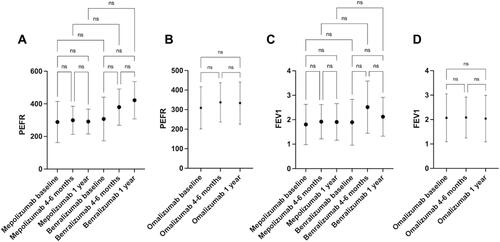
Table 2 Patient Demographics According to Treatment Received
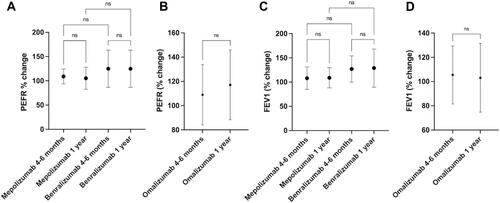
Figure 3 Percentage changes in PEFR and FEV1 scores from baseline over time for patients receiving (A and C) mepolizumab and benralizumab and (B and D) omalizumab.