Figures & data
Table 1 Demographics of Patients with Asthma in the Continuous and Switched Groups
Table 2 Factors Related to Eosinophilic Chronic Rhinosinusitis in the Continuous and Switched Groups
Figure 1 Frequency of switching biologics in the switched group. Switching biologics was observed once in six patients, twice in five patients, and three times in two patients.
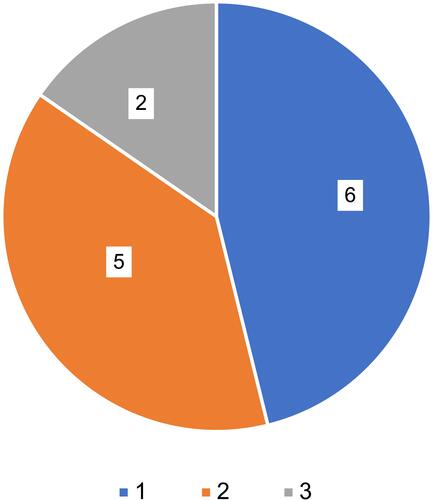
Table 3 Associated Factors with Time to Switch Biologics
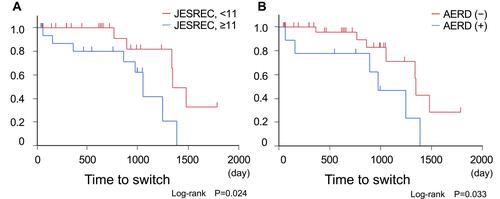
Figure 2 Kaplan–Meier curves for time to switch the biologics. (A) The subgroup analysis on JESREC score. The time to switch biologics was significantly shorter in the subgroup with the JESREC score of 11 or higher than that with the JESREC score <11 (P <0.05). (B) The subgroup analysis on AERD. The time to switch biologics was significantly shorter in the subgroup with AERD than that without AERD (P <0.05).