Figures & data
Figure 1 Schematic representation of experimental design (A) and overview of groups (B).
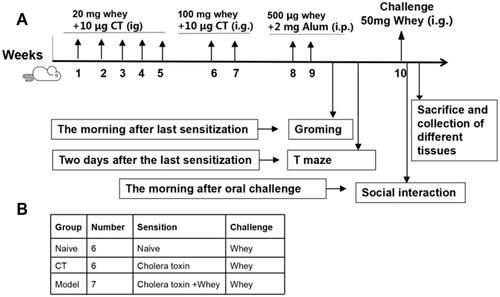
Figure 2 Response to oral whey challenge in CMA mice, sham-sensitized control mice and naive mice. Post-challenge body temperatures (A). Anaphylactic symptom scores (B). Post-challenge plasma histamine levels (C) and serum levels of mouse mast cell protease-1 (mMCP-1) (D), Whey-specific IgE (E), IgG1 (F), IgG2a (G), IL-6 (H) and IL-10 (I) were measured by Elisa. **P<0.01; ***P<0.001; ****P<0.0001 vs sham. n=6 mice per group. Data are presented as mean±SEM. One-way ANOVA was used for comparison among groups.
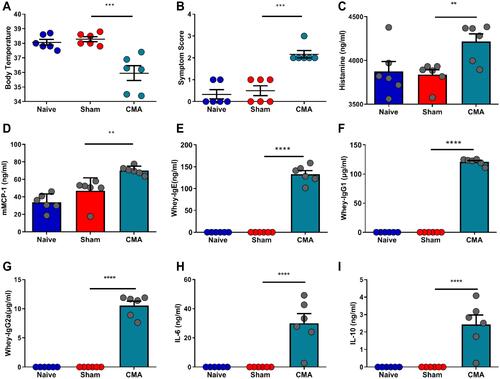
Figure 3 Behavioral changes after challenge in CMA mice compared to sham mice. (A) Diagram of social interaction test. Mice were placed in a 45×45 cm open field, with an empty wire cage located against one wall. Grey rectangle is the interaction zone, white circle is the metal cage with a gender- and age-matched unfamiliar mouse (target) in it. Compared with the sham group, allergic mice spend more time on self-grooming as assessed by visual observation (E). The latency of first approach to the social target were was prolonged in social interaction test (B), the time in the interaction zone were was shortened (C) and the allergic mice were more inclined to enter the same arm in T-maze (F). However, no changes were observed between the groups for the movement distance (D). *P<0.05; **P<0.01; ****P<0.0001 vs sham. n=6 mice per group. Data are presented as mean±SEM. One-way ANOVA was used for comparison among groups.
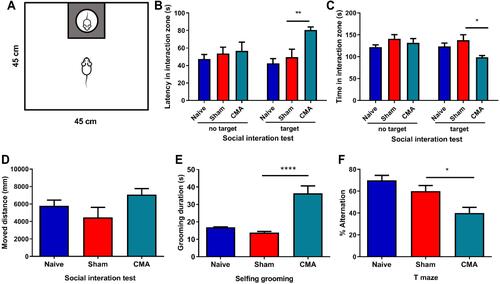
Figure 4 Intestinal anaphylaxis in CMA mice. Compared to sham mice, allergic mice showed significantly increased expression of small intestine IL-18 (A), IL-33 (B) and m-TOR (C) mRNA. H&E staining for the jejunum (200 × magnification, (D)). TB staining for observing mast cells in jejunum (400 × magnification, (E)), Scale bar: 50 μm. *P<0.05 vs sham. n=3 for (A–D). Data are presented as mean±SEM. One-way ANOVA was used for comparison among groups.
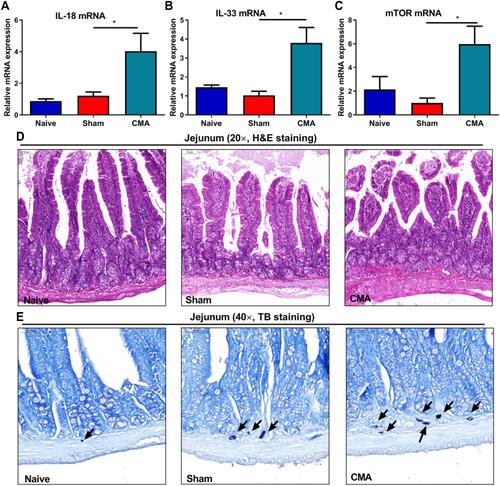
Figure 5 Expression of 5-hmC (5-hydroxymethylcytosine) in the hypothalamus, c-Fos in the LO (lateralorbital) PFC (prefrontal cortex) and 5-HT1Ain amygdala and PFC of CMA mice. Immunohistochemistry of the hypothalamus (A), LO (B), amygdala (C) and PFC (D) (400 × magnification). Compared to sham mice allergic mice showed significantly increased expression of 5-hmc (E) and c-fos (F), decreased 5-HT1A was observed in the amygdala (G) and PFC (H) of the whey-sensitized mice.Scale bar: 50 μm. *P<0.05 vs sham. n=3 for panels. Data are presented as mean±SEM. One-way ANOVA was used for comparison among groups.
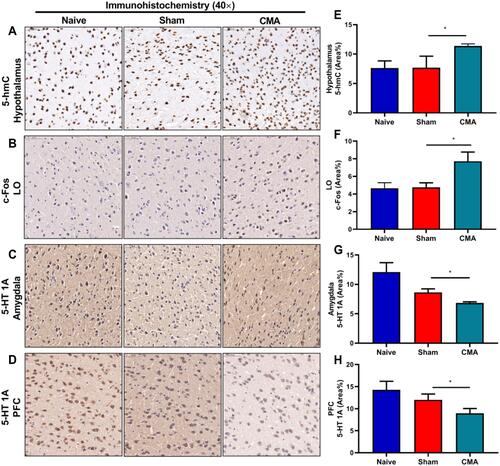
Figure 6 Continue.
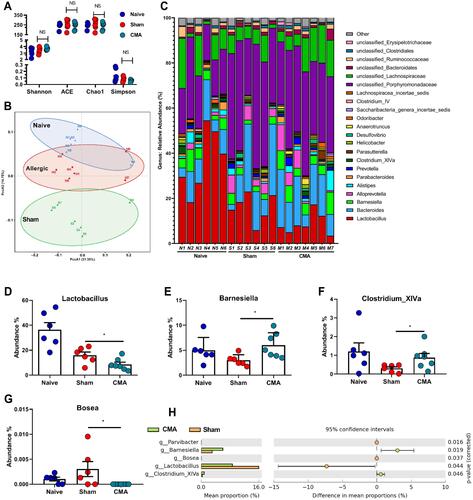
Figure 6 Gut microbiota diversity and structure analysis. (A) Gut microbiome diversity differences between the naive, sham and allergic group were estimated by the Shannon, ACE, Chao1 and Simpson indices. (B) PCoA plot base of the relative abundance of OTUs (Unweighted UniFrac PCoA plots). Naive group (gray dots), Sham group (red dots), Allergic group (blue dots). A dot represent individual samples. (C) Relative Abundance of bacterial genus in naive, sham and allergic groups. The abundance of Lactobacillus (D), Barnesiella (E), Clostredium_XIVa (F) and Bosea (G) in each group. (H) The bacterial genus difference analysis (95% confidence intervals). (I) Heatmap showing the abundance of 72 OTUs and their Represented bacterial taxa information (genus, family and phylum). *P<0.05 vs sham. n=6 for the naive and sham group, n=7 for the allergic group). Data are presented as mean±SEM. Student t test was used for comparison among groups.
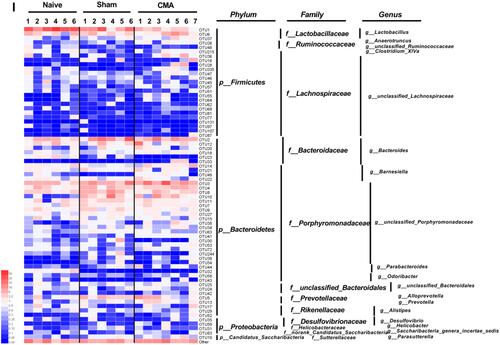
Figure 7 mTOR signaling pathway analysis. (A) The green and yellow areas indicate hippocampus and hypothalamus respectively. (B) The red area indicates amygdala. (C) The blue area indicates prefrontal cortex. (D) Representative Western blots of hippocampus, hypothalamus, amygdala and prefrontal cortex. The expression of AKT (E and F), p-AKT (G and H), p70S6K (K and L), p-mTOR (O and P) and mTOR (M and N) in hippocampus, hypothalamus, amygdala and prefrontal cortex. The ratios of p-AKT/AKT and p-mTOR/mTOR in hippocampus, hypothalamus amygdala and prefrontal cortex (I, J, Q, R). *P < 0.05; **P < 0.01; ***P<0.001; ****P < 0.0001 vs sham. n=3 mice per group. Data are presented as mean±SEM. One-way ANOVA was used for comparison among groups.
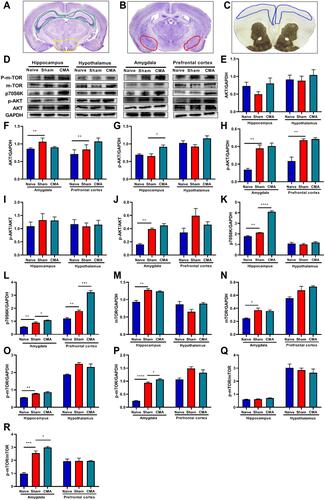
Figure 8 Pearson’s correlation analysis to understand relationship between 4 key bacterial species identified, mTOR signaling proteins, autism-like behavioral, histamine and mMCP-1. The cell value are Pearson’s r (r < 0, Negatively correlated, r > 0, positively correlated). *P < 0.05; **P < 0.01; ****P < 0.0001 vs sham. n=3 mice per group. Data are presented as mean ± SEM.
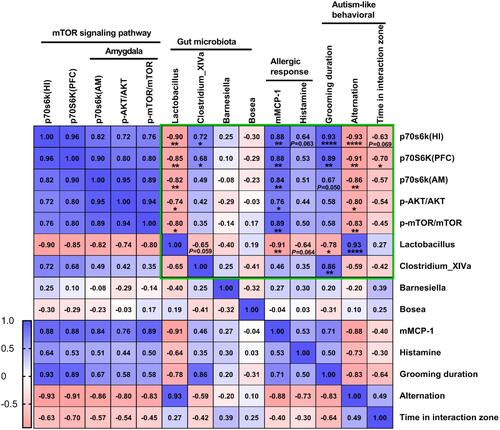
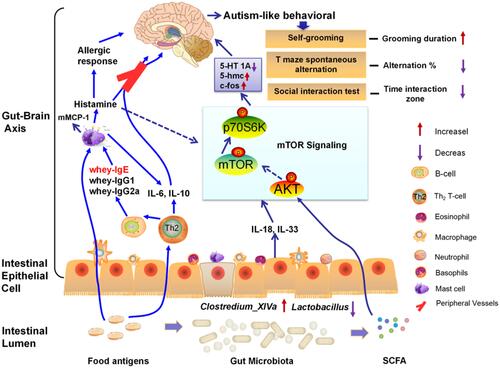
Figure 9 Gut microbiota and mTOR signaling pathway: plays an important role in cow’s mike allergy-associated ASD.