Figures & data
Table 1 Baseline Characteristics
Figure 1 Prevalence of positive skin prick test by age and gender at baseline. *p<0.05 male vs female.
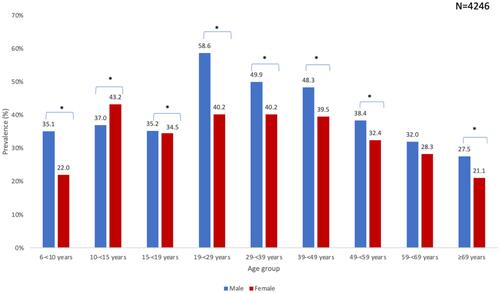
Figure 2 Prevalence of specific SPT at baseline in childhood /adolescence vs adulthood. *p<0.05 childhood/adolescence vs adulthood.
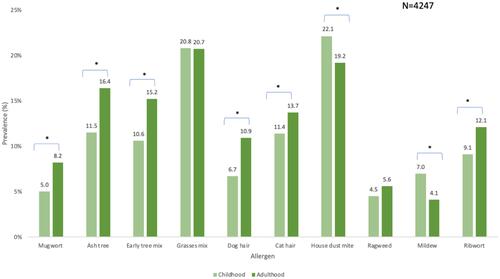
Figure 3 Prevalence of each allergen in childhood/adolescence by gender. *p<0.05 male vs female.
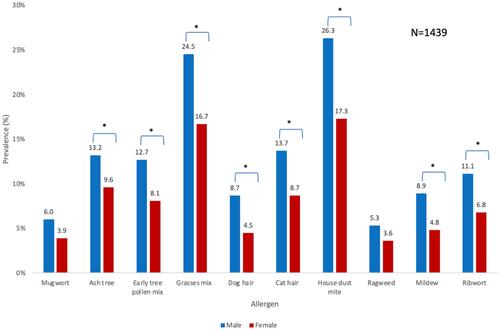
Figure 4 Prevalence of each allergen in adulthood by gender. *p<0.05 male vs female.
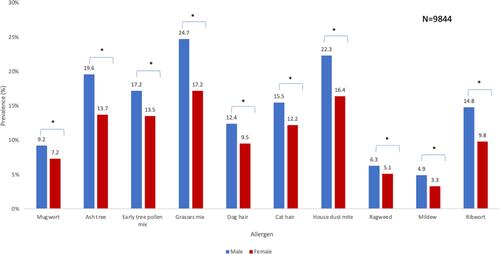
Table 2 Associated Factors for a Positive SPT in Childhood/Adolescence at Baseline, Mutually Adjusted (N=1439)
Table 3 Associated Factors for a Positive SPT in Adulthood at Baseline, Mutually Adjusted (N=9844)
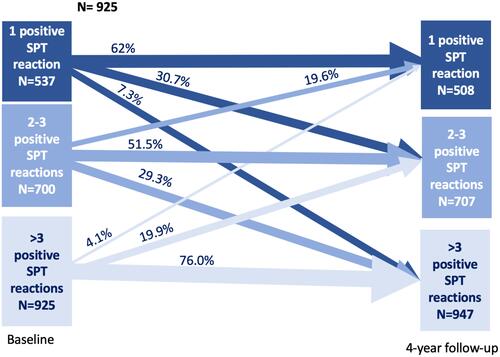
Figure 5 Flow graph of positive skin prick test at baseline and after a 4-year follow-up period in childhood/adolescence.
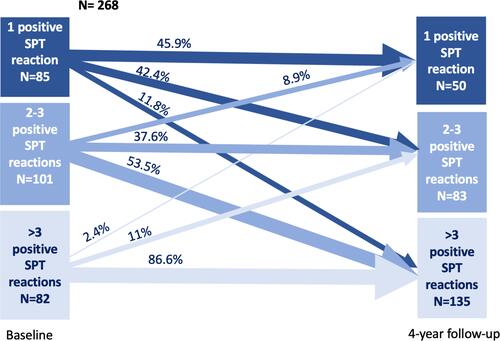
Figure 6 Flow graph of positive skin prick test at baseline and after a 4-year follow-up period in adulthood.