Figures & data
Table 1 Demographic Data of the Study Subjects
Figure 1 Increased serum thymus and activation-regulated chemokine (TARC) levels in asthmatic patients. Comparison of serum TARC levels (A) between asthmatics and healthy controls (HCs) as well as (B) among allergic asthmatics, nonallergic asthmatics, and HCs. Data are presented as Geometric mean with 95% CI. **P < 0.010 by Mann–Whitney U-test or Kruskal–Wallis test. ns, not significant. Significant negative correlations between serum TARC and (C) FEV1%/(D) MMEF%. Data are represented as Spearman correlation coefficient r (P value). FEV1, forced expiratory volume in 1 second; MMEF, maximal mid-expiratory flow.
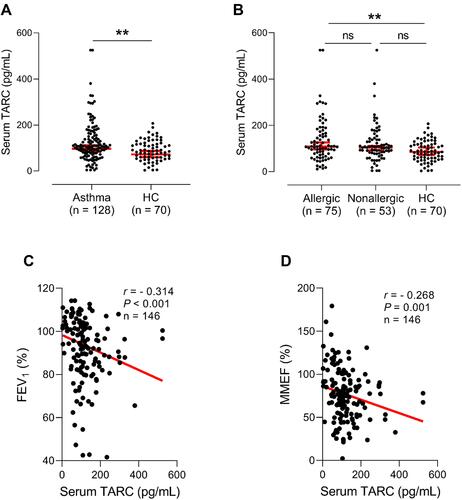
Table 2 Comparison of Demographic Characteristics Between the TARC-High and TARC-Low Groups
Figure 2 Comparison of serum free and total IgE levels between the activation-regulated chemokine (TARC)-high and TARC-low groups. Concentrations of serum levels of (A) free and (B) total IgE between the TARC-high and TARC-low groups. Data are presented as Geometric mean with 95% CI. *P < 0.050 by Mann–Whitney U-test. IgE, immunoglobulin E.
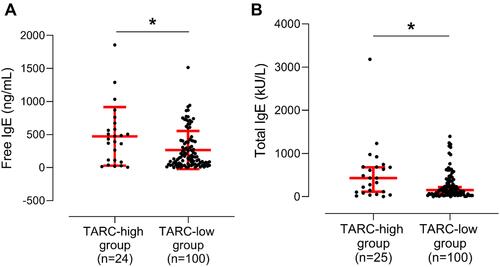
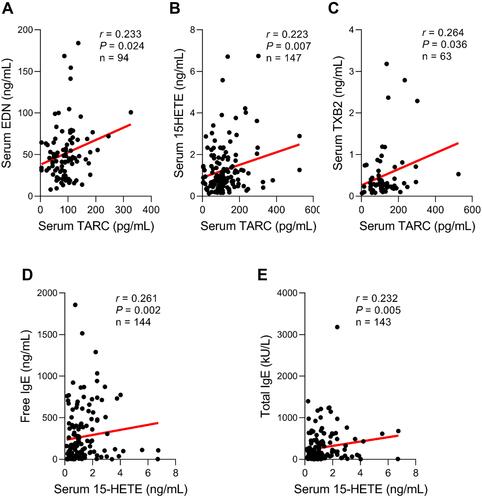
Figure 3 Correlations between serum thymus and activation-regulated chemokine (TARC) levels and EDN/lipid mediators. Positive correlations between serum TARC and (A) EDN/ (B) 15-HETE/ (C) TXB2 levels. Data are represented as Pearson correlation coefficient r (P value). Positive correlations between serum 15-HETE and (D) free IgE/ (E) total IgE levels. Data are represented as Spearman correlation coefficient r (P value). 15-HETE, 15-hydroxyeicosatetraenoic acid; EDN, eosinophil-derived neurotoxin; TXB2, thromboxane B2.