Figures & data
Table 1 Baseline Characteristics of All Study Populations
Table 2 Clinical Information of Asthmatic Children
Figure 1 Continued.
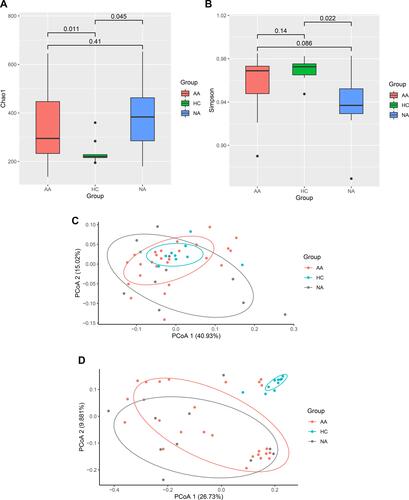
Figure 1 Characters of gut microbiome. (A and B) Alpha diversity (Chao1 and Simpson parameter) in allergic, non-allergic asthma and healthy control groups. (C) PCoA plot based on weighted UniFrac distance, (D) PCoA plot based on unweighted UniFrac distance. (E) Relative abundance of top 10 phyla by groups. The height of bars represents relative abundance. (F) LEfSe analysis between allergic asthma and healthy control groups. (G) LEfSe analysis between non-allergic asthma and healthy control groups. The graph of LEfSe distinguished the microbial communities of each group with LDA > 2 and p < 0.05.
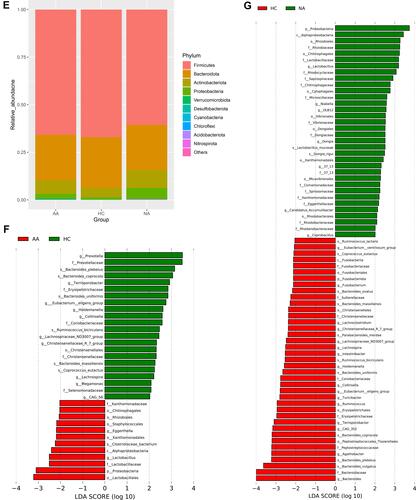
Table 3 Genera with Significant Differences in Relative Abundance Between Asthmatic Group and Healthy Control Group (Wilcoxon Test)
Table 4 The Involved Metabolic Pathways of the Altered Metabolites in Allergic and Non-Allergic Asthma Groups
Figure 2 Continued.
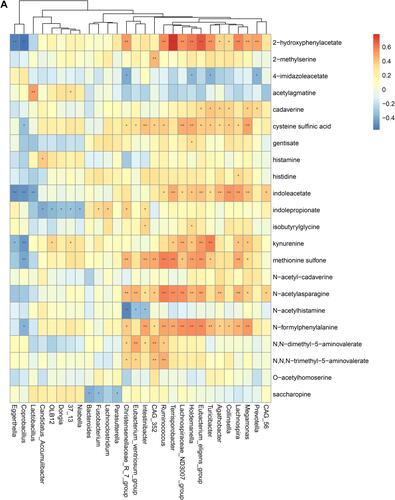
Figure 2 Continued.
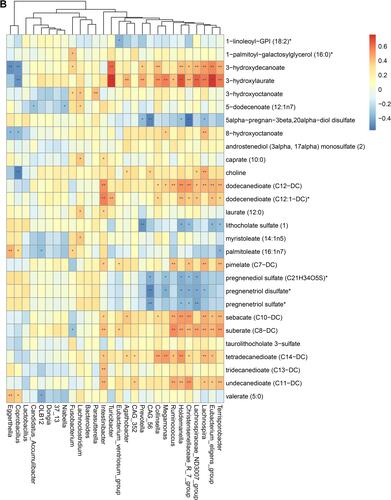
Figure 2 Continued.
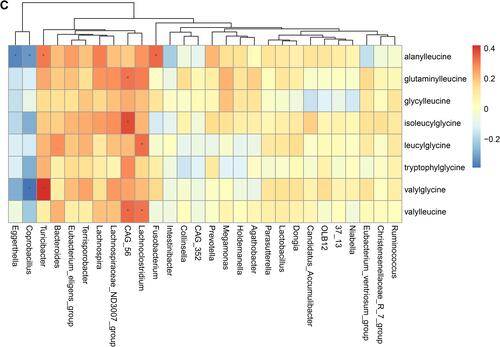
Figure 2 Continued.
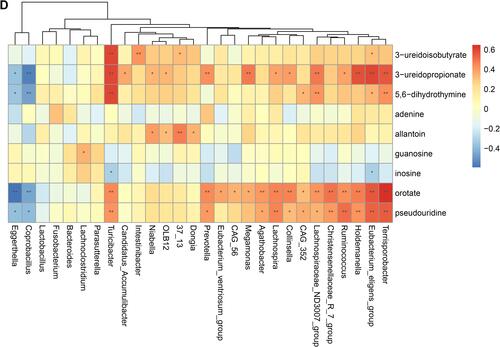
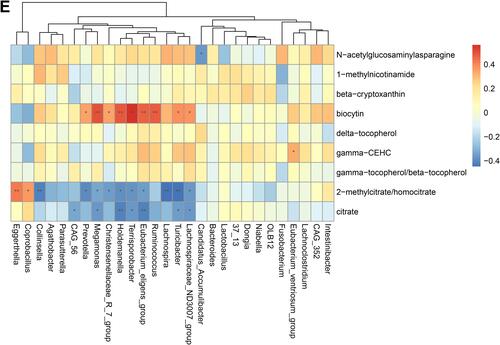
Figure 2 Spearman correlation heatmap for significantly altered metabolites and genera in asthmatics. *p <0.05, **p <0.01. (A) Correlation heatmap for amino acid. (B) Correlation heatmap for Lipid. (C) Correlation heatmap for peptide. (D) Correlation heatmap for nucleotide. (E) Correlation heatmap for others, including carbohydrate, energy, cofactors and vitamins.