Figures & data
Figure 1 Proportion of patients with NPS and NC score change (improved, stable, and worsened) over time (Weeks 4 through 52) in SINUS-52.
Notes: ***p<0.0001. The proportion of patients treated with placebo or dupilumab 300 mg q2w with improvement (change from baseline <0), stable (change = 0), and worsening (change >0) of NPS or NC over time in SINUS-52. ORs for improvement with dupilumab vs placebo are shown above each pair of bars (patients with improvement were considered as responders and patients with no change or worsening were considered as non-responders).
Abbreviations: CI, confidence interval; NC, nasal congestion/obstruction; NPS, nasal polyp score; OR, odds ratio; q2w, every 2 weeks.
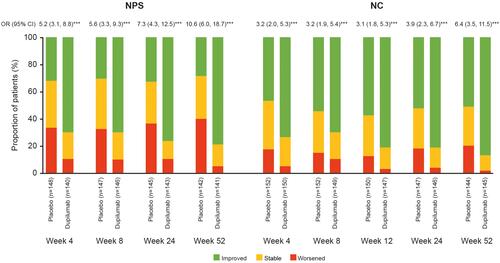
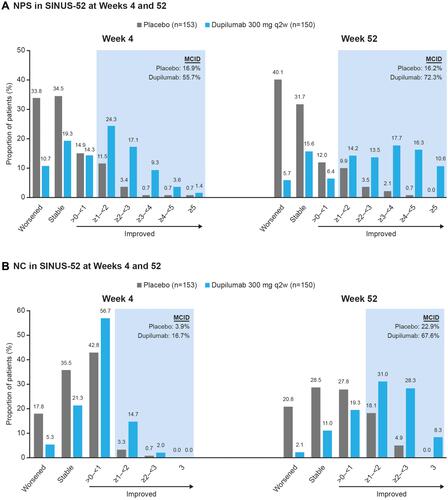
Figure 2 Proportion of patients with (A) NPS and (B) NC score change (stable, worsened, and categories of improvement) at Weeks 4 and 52 in SINUS-52.
Notes: The proportion of patients treated with placebo or dupilumab 300 mg q2w in SINUS-52 with improvement in (A) NPS or (B) NC at Weeks 4 and 52, according to absolute category of improvement. The shaded area represents clinically important improvement (≥1-point improvement). The proportions of patients with stable (change = 0) or worsening (change >0) of NPS or NC are shown for comparison.
Abbreviations: MCID, minimum clinically important difference; NC, nasal congestion/obstruction; NPS, nasal polyp score; q2w, every 2 weeks.