Figures & data
Table 1 Comparison of Baseline Patient Characteristics
Table 2 Comparison of Indicators Between Responders and Non-Responders
Figure 1 Total activation numbers in BT responders and non-responders in main bronchial ablation and non-main bronchial ablation groups.
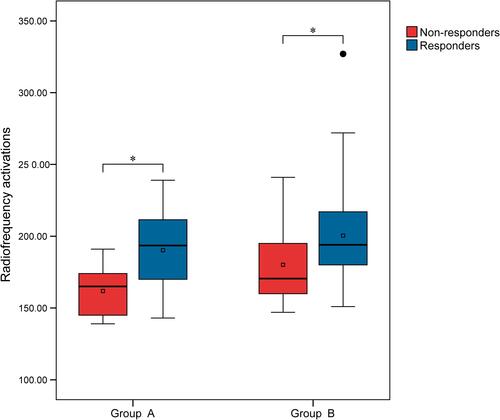
Table 3 The Estimated Coefficients of Lasso Regression
Table 4 Univariate Analysis for Clinical Response to BT
Table 5 Logistic Regression for the Influencing Factors of Clinical Response to BT
Table 6 Parameter Estimation and Hypothesis Testing for the Influencing Factors of ACQ Improvement Before and 6 Months After BT Sessions
Figure 2 Correlation between baseline ACQ and ACQ improvement.
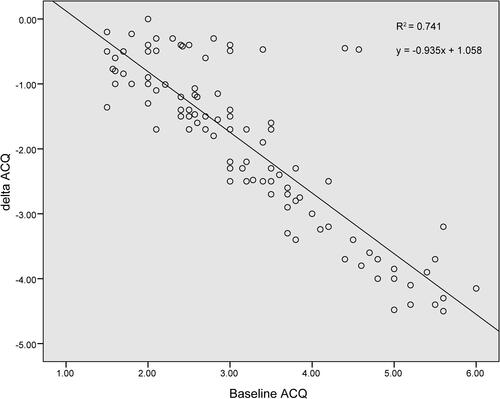
Figure 3 Correlation between activation number in the third BT session and ACQ improvement.
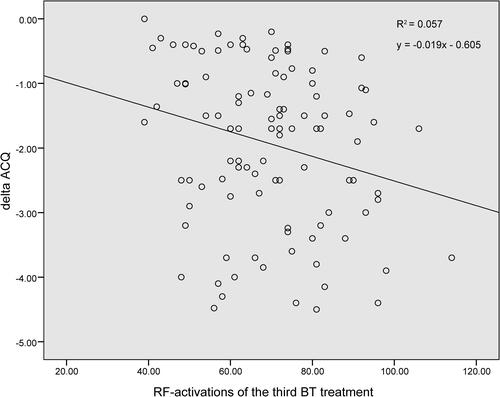
Table 7 Comparison Among the Cohorts with Different Activation Numbers
Figure 4 Post-BT ACQ score in each cohort with different activation numbers.
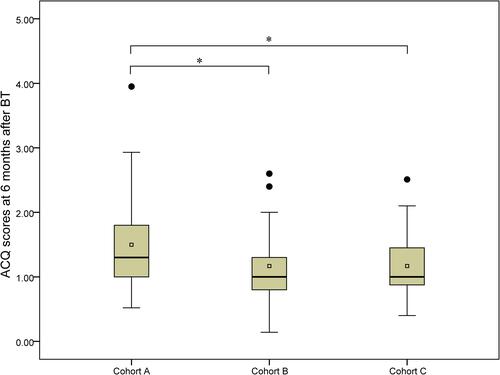
Figure 5 Post-BT FVE1 (%, predicted) in each cohort with different activation numbers.
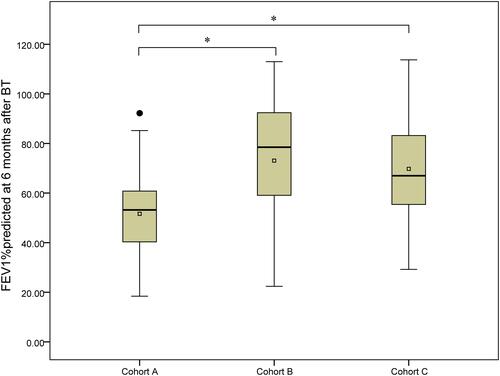
Figure 6 Post-BT FEV1 in each cohort with different activation numbers.
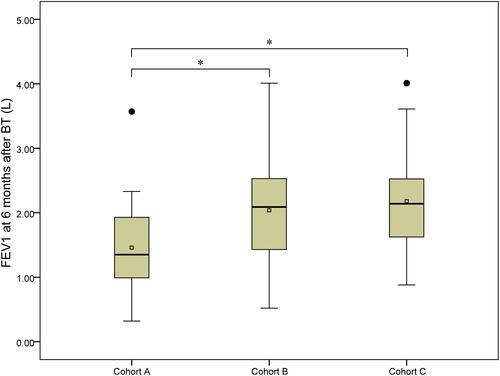
Figure 7 Post-BT FVC in each cohort with different activation numbers.
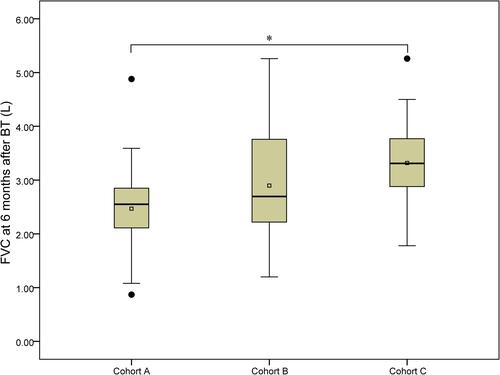
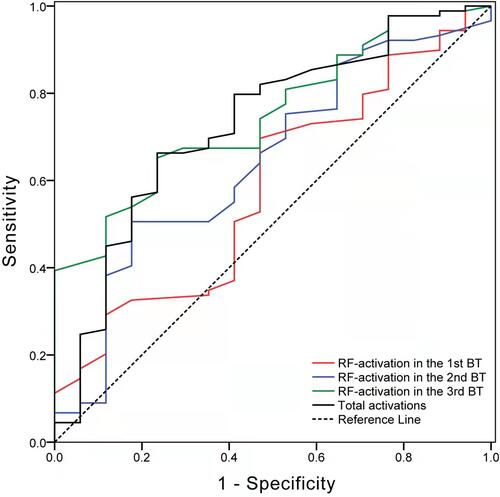
Figure 8 ROC curves in predicting the clinical response to BT with different activation numbers.