Figures & data
Table 1 Characteristics of Cases Before Initiating Anti-IL5/IL5R Therapies and at 3- and 12-Months Post-Treatment Initiation
Figure 1 Flow chart of study participants.

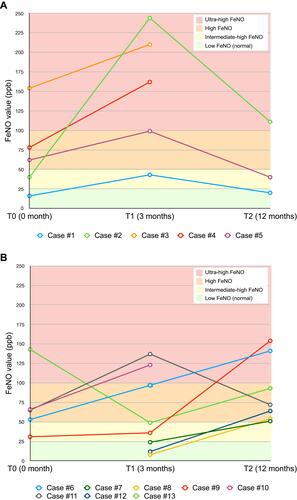
Figure 2 FeNO values at T0, T1 and T2 for patients who experienced a significant increase in FeNO between at least two time points on (A) Benralizumab and (B) Mepolizumab: The background colors (green, yellow, orange, red) help interpret FeNO levels: The green zone is low FeNO (≤25 ppb), which corresponds to normal values: Intermediate-high FeNO = 26–49 ppb, high FeNO = 50–99 ppb, and ultra-high FeNO = ≥100 ppb: Note that the incomplete curves are explained by missing data at T0 or T2: For case #6 who had missing data at T1, we assigned a fictive value at T1, representing the mean of T0 and T2: This estimated value is only used in this graph to help visualize the variation between T0 and T2 but was not considered in data analysis.