Figures & data
Figure 1 Design of the open-label cross-over study. Solid line, dual therapy with fluticasone propionate/formoterol fumarate (FP/FM); dotted line, tiotropium bromide (TIO) add-on therapy to FP/FM. ACQ, asthma control questionnaire; ASK-12, adherence status with knowledge-12; CAT, chronic obstructive pulmonary disease assessment test; FeNO, fractional exhaled nitric oxide; R, randomization.
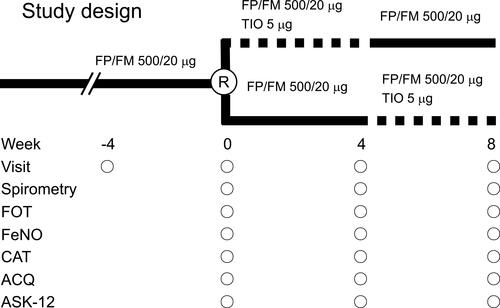
Table 1 Patient Characteristics
Table 2 Spirometry Parameters After Each Treatment
Figure 2 Individual data for forced vital capacity (FVC) before each treatment with fluticasone propionate/formoterol fumarate (FP/FM) combination therapy and after tiotropium bromide (TIO) add-on therapy to FP/FM in patients with asthma-chronic obstructive pulmonary disease overlap (ACO). Each panel shows the parameter changes for all patients and the mean ± standard deviation (SD). P < 0.05, determined by one-way analysis of variance (ANOVA).
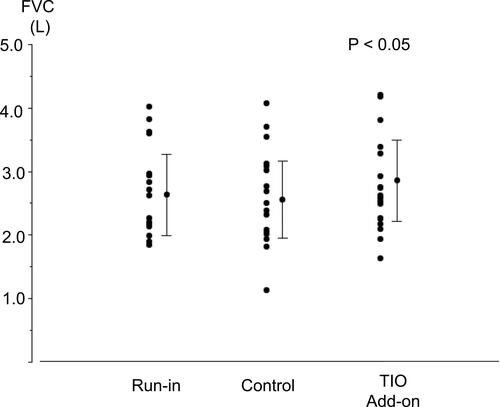
Figure 3 Individual data for forced expiratory volume in 1 s (FEV1) before each treatment and after fluticasone propionate/formoterol fumarate (FP/FM) combination therapy and tiotropium bromide (TIO) add-on therapy to FP/FM in patients with asthma-chronic obstructive pulmonary disease overlap (ACO). Each panel shows the parameter changes for all patients and the mean ± standard deviation (SD). P< 0.01, determined by one-way ANOVA.
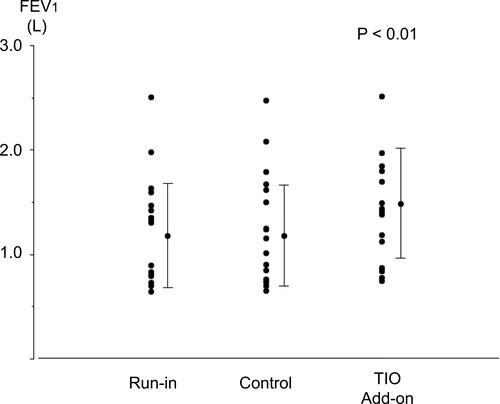
Table 3 FOT Parameters, FeNO, CAT, ACT and Blood Examination Parameters After Each Treatment
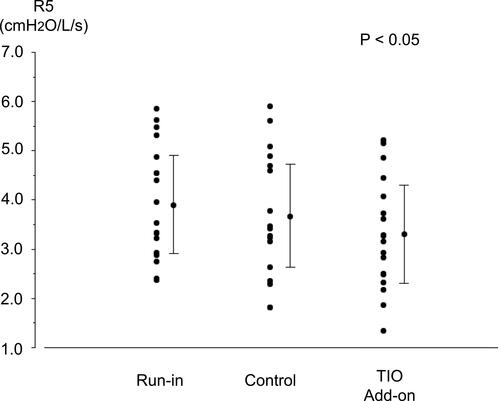
Figure 4 Individual data for resistance at 5 Hz (R5) before each treatment and after fluticasone propionate/formoterol fumarate (FP/FM) combination therapy and tiotropium bromide (TIO) add-on therapy to FP/FM in patients with asthma-chronic obstructive pulmonary disease overlap (ACO). Each panel shows the parameter changes for all patients and the mean ± standard deviation (SD). P < 0.05, determined by one-way ANOVA.