Figures & data
Figure 1 miR-93-5p interacts with H19 and Orai1 respectively. (A) Diagram shows the structure of H19 luciferase in PGK reporter. The predicted binding sites for sponging miR-93-5p and the corresponding mutation sites in H19 are shown in red. (B) Diagram shows the structure of Orai1 luciferase in PGK reporter. The predicted binding sites for sponging miR-93-5p and the corresponding mutation sites in Orai1 are shown in red. (C and D) Luciferase reporter gene assay was used to determine the interaction between miRNA-93-5p and H19 (C) and Orai1 (D). ***P< 0.001. n=5 for each experiment.
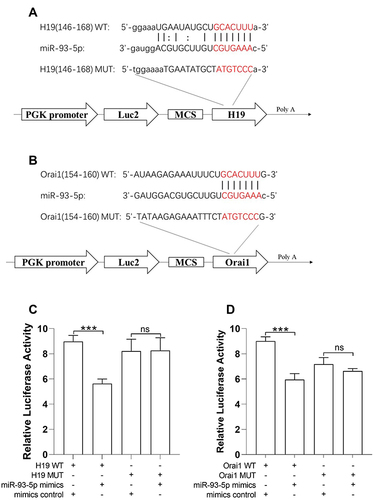
Figure 2 Effects of IL-13 on the expression of H19, miR-93-5p and Orai1 in hBSMCs. In vitro cultured human bronchial smooth muscle cells (hBSMCs) were stimulated with different concentrations of IL-13 for 24 h and the relative expression of lncRNA H19 (A), miR-93-5p (B) and Orai1 mRNA (C) was assayed with RT-qPCR, the protein expression of Orai1 (D) was determined with Western blotting. β-actin was used as internal control for protein expression. Con: control hBSMCs without IL-13 treatment; *P < 0.05, **P<0.01. n=3 for each experiment.
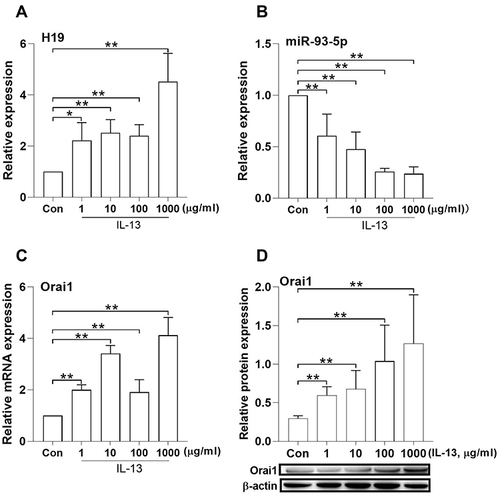
Figure 3 Effects of H19 knock-down on the expression of H19, miR-93-5p and Orai1, and hBSMCs proliferation and migration. (A) In vitro cultured hBSMCs were treated with H19-specific siRNA (H19 siRNA) or negative control siRNA (siRNA NC), the expression of H19 was assessed with RT-qPCR. (B-D) H19 knockdown on the expression of H19, miR-93-5p and Orai1 in the presence of IL-13. In vitro cultured hBSMCs were stimulated with or without IL-13 (10 ng/mL) and transfected with H19-specific siRNA. The mRNA expression was assessed with RT-qPCR. (E) The protein expression of Orai1 in hBSMCs was determined with Western blotting, β-actin was used as internal control. (F) The effect of H19-specific siRNA on IL-13-induced hBSMCs proliferation rates after 24 h and 48 h was assayed with CCK-8 methods. (G) The effect of H-19-specific siRNA on IL-13-induced hBSMCs migration rates was investigated with wound healing test. *P<0.05; **P<0.01;****P<0.0001. n=3 for each experiment.
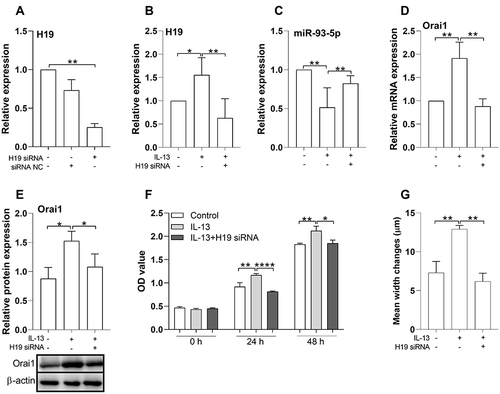
Figure 4 Effects of miR-93-5p mimic and inhibitor on the expression of Orai1, the proliferation and migration rates of hBSMCs. In vitro cultured hBSMCs were transinfected with miR-93-5p mimic and inhibitor respectively under stimulation with IL-13 (10 ng/mL). (A) Relative mRNA expression of Orai1 compared with control (without IL-13 and transfection). (B) Relative protein expression of Orai1 under different treatments, β-actin was used as internal control. (C) Proliferation rates of hBSMCs after 24 h and 48 h with different treatments as indicated. (D) Migration rates of hBSMCs under different treatments as indicated. *P<0.05; **P <0.01; ***P<0.001. n=3 for each experiment.
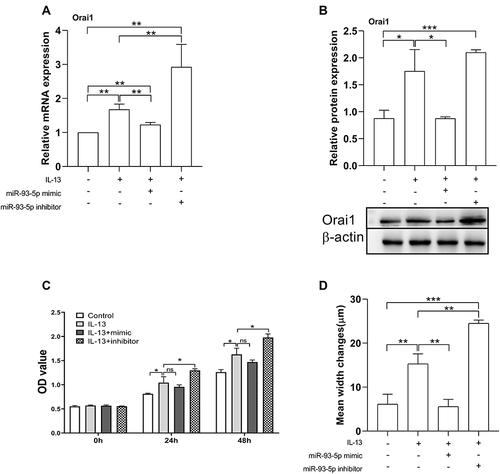
Figure 5 miR-93-5p mediated the effects of H19 on Orai1 expression, and the proliferation and migration rates of hBSMCs. In vitro cultured hBSMCs were transinfected with H19-specific siRNA with or without miR-93-5p mimic or inhibitor under stimulation with IL-13 (10 ng/mL). (A) Relative mRNA expression of Orai1 compared with control (without IL-13 and transfection). (B) Relative protein expression of Orai1 under different treatments, β-actin was used as internal control. (C) Proliferation rates of hBSMCs after 24 h and 48 h with different treatments as indicated. (D) Migration rates of hBSMCs under different treatments as indicated. *P<0.05; **P<0.01; ***P<0.001. n=3 for each experiment.
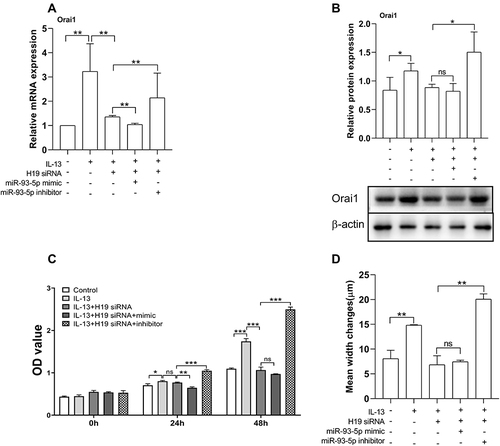
Figure 6 The effects of H19 inhibition on Orai1 expression and airway inflammation in acute asthma murine model. Acute asthma mice (AA) were intranasal administrated with lentivirus-carrying H19-specific siRNA (AA-si H19) or control scramble siRNA (AA-si-Con) (n = 5 mice in each group). The expression of H19 (A) and mRNA expression of Orai1 (B) in the lungs was assessed with RT-qPCR. (C) The protein expression of Orai1 in the lungs. Inserted are typical Western blotting assays of Orai1 and internal control protein β-actin. (D) Representative H&E staining of lung sections to show inflammatory cell infiltration in the lungs (200×). (E) Inflammation scores (n=3 in each group). (F) Representative PAS staining of lung sections to show mucus hypersecretion. (G) Ratio of PAS+ area to perimeter of bronchi to quantify mucus hypersecretion. *P<0.05; **P<0.01; ***P<0.001; i. control (AC) mice; ii. AA mice; iii. AA-si H19 mice; iv. AA-si-Con mice.
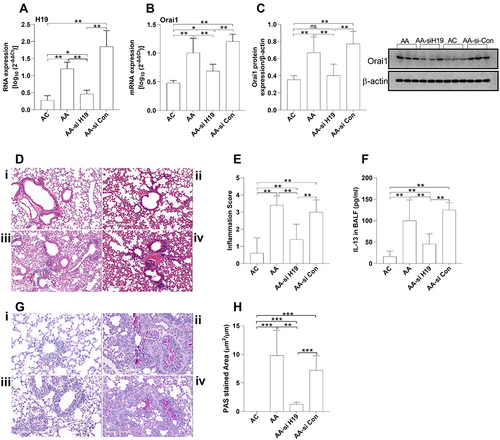
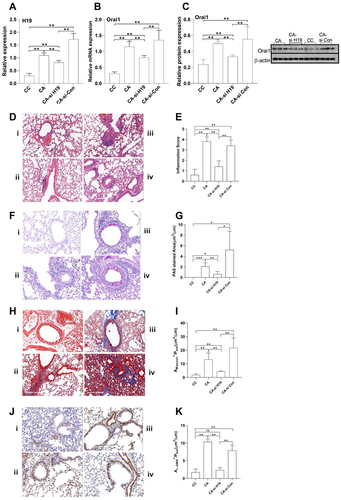
Figure 7 The impact of H19 inhibition on Orai1 expression, airway inflammation and airway remodeling in chronic asthma murine model. Chronic asthma mice (CA) were intranasal administrated with lentivirus carrying H19-specific siRNA (CA-si H19) or control scramble siRNA (CA-si-Con) (n=5 mice in each group). The expression of H19 (A) and mRNA expression of Orai1 (B) in the lungs was assessed with RT-qPCR. (C) The protein expression of Orai1 in the lungs. Inserted are typical Western blotting assays of Orai1 and internal control protein β-actin. (D) Representative H&E staining of lung sections to show inflammatory cell infiltration in the lungs (200×). (E) Inflammation scores (n=3 in each group). (F) Representative PAS staining to show goblet cell hyperplasia in bronchial mucus. (G) Ratio of PAS+ area to perimeters of bronchi to quantify mucus hypersecretion. (H) Representative Masson staining of lung sections to show collagen deposition in mouse lungs (200×). (I) Ratio of Masson+ area to perimeters of bronchi to quantify collagen deposition. (J) Representative α-SMA immunostaining to show hyperplasia and hypertrophy of ASM in the lungs of mice (200×). (K) Ratio of α-SMA+ area to perimeter of bronchi to quantify hypertrophy of ASM. n=3 in each group. *P<0.05; **P<0.01; ***P<0.001; i: control (CC) mice; ii: CA mice; iii: CA-si H19 mice; iv: CA-si Con mice.