Figures & data
Figure 1 PRISMA flow diagram for (A) BOI SLR and (B) ICS/Biologics SLR.

Table 1 Prevalence of Asthma in General Population and COVID-19 Positive Population
Table 2 Prevalence of COPD in General Population and COVID-19 Positive Population
Figure 2 Forest plots of odds ratios of asthma compared to non-asthma patients for COVID-19 related HCRU and mortality. Data is presented for all studies with evaluable evidence and stratified by quality of studies. Outcomes included hospitalization (A), ICU admission (B), ventilation (C), length of stay (D), and mortality (E).
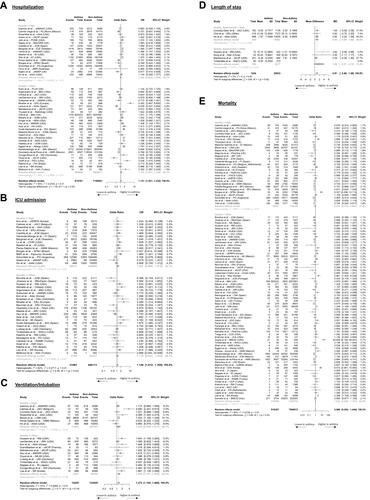
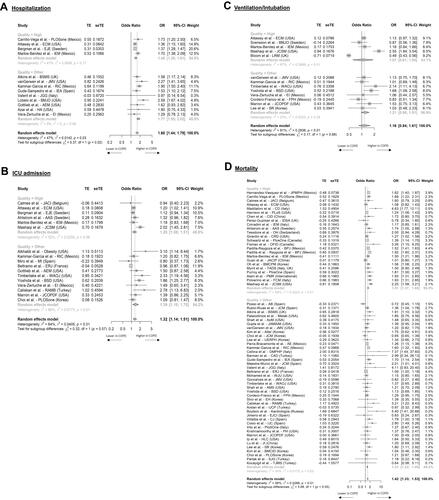
Figure 3 Forest plots summarizing adjusted odds ratios for COPD compared to non-COPD patients for COVID-19 related HCRU and mortality. Data is presented for all studies with evaluable evidence. Outcomes included hospitalization (A), ICU admission (B), ventilation (C), and mortality (D).