Figures & data
Figure 1 Acute bronchospasm on a computed tomography scan. (A–C) Baseline computed tomography images of the trachea, carina, and main bronchi. (D–F) Computed tomography images during acute bronchospasm at the trachea (arrow up), carina (arrow sideways), and main bronchi (right bronchus: arrow down). (G–I) Computed tomography images of the trachea, carina, and main bronchi 10 minutes after the administration of albuterol, which show resolution back to baseline.
![Figure 1 Acute bronchospasm on a computed tomography scan. (A–C) Baseline computed tomography images of the trachea, carina, and main bronchi. (D–F) Computed tomography images during acute bronchospasm at the trachea (arrow up), carina (arrow sideways), and main bronchi (right bronchus: arrow down). (G–I) Computed tomography images of the trachea, carina, and main bronchi 10 minutes after the administration of albuterol, which show resolution back to baseline.](/cms/asset/7dfc1350-a114-456f-b930-83960cb33de7/djaa_a_36127_f0001_c.jpg)
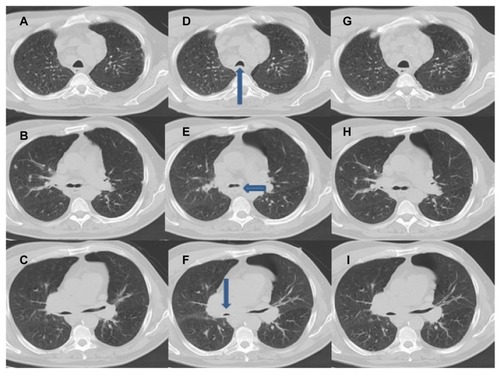
Table 1 Quantitative assessment of patient airways