Figures & data
Table 1 Patient Characteristics at Enrollmenta
Figure 1 Distribution of CHRONICLE sites across the United States.
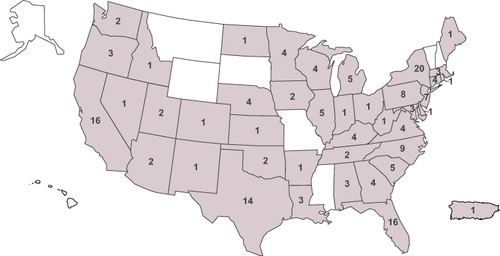
Figure 2 Overall rates of (A) asthma exacerbations, (B) exacerbation-related emergency department visits, and (C) asthma hospitalizations by month from July 2018 through July 2021. (A–C) Gray bands represent the implementation of state-level COVID-19 restrictions.
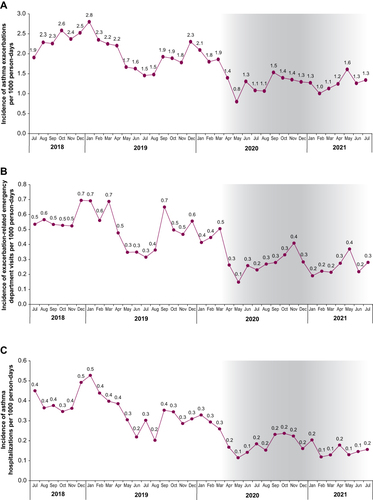
Figure 3 Monthly exacerbation rates by treatment category: 3-month moving averages. Gray bands represent the implementation of COVID-19 restrictions. Biologic use and SCS use were not mutually exclusive.
Abbreviations: 3 per. Mov. Avg., moving 3-month averages; SCS, systemic corticosteroids.
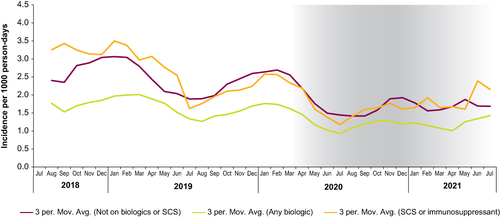
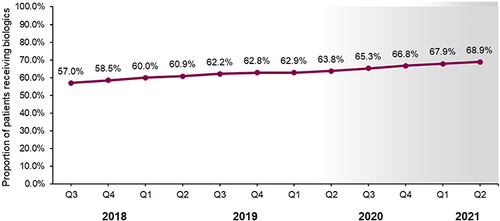
Figure 4 Proportion of patients receiving treatment with biologics from 2018 through 2020. The gray band represents the implementation of COVID-19 restrictions.
Abbreviation: Q, quarter.