Figures & data
Table 1 Annual Nationwide Administrative Prevalence of Hay Fever, Overall and by Sex in the Years 2010 to 2019
Figure 1 Age- and sex-standardized diagnostic prevalence of hay fever in total and by sex over time (2010–2019).
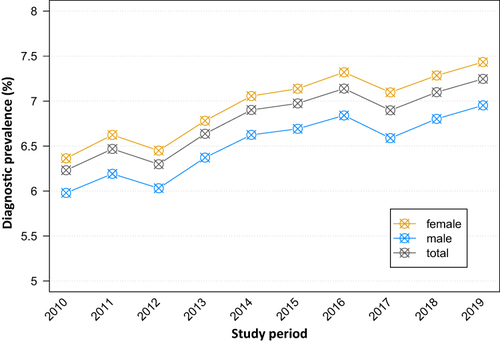
Figure 2 Age- and sex-specific diagnostic prevalence of hay fever in 2010 and 2019.
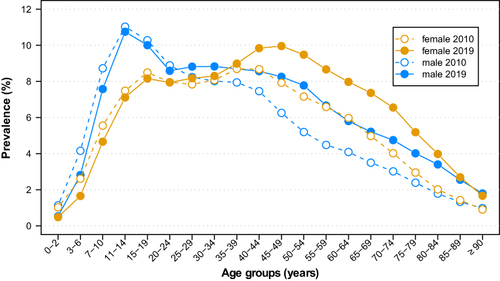
Figure 3 Age- and sex-standardized diagnostic prevalence of hay fever in districts by district type in 2019 (A), its development over time (2010–2019) by district type (B) and age-specific prevalence by district type in 2019 with prevalence ratios as the quotient of the prevalence in big urban municipalities and in rural areas with a low population density (C).
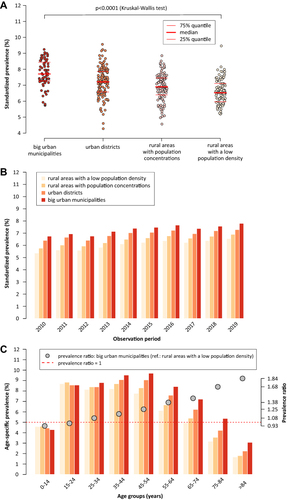
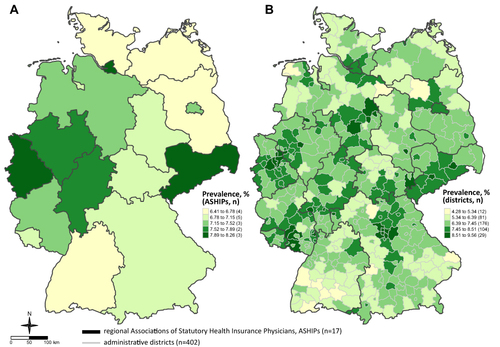
Figure 4 Age- and sex-standardized diagnostic prevalence of hay fever in ASHIP regions (A) and by district (B) in 2019.